Enhancing Kubernetes Observability with Loki and Alloy
In our previous article, we set up Prometheus and Grafana using the kube-prometheus-stack Helm chart to monitor the health and performance of our Kubernetes cluster.
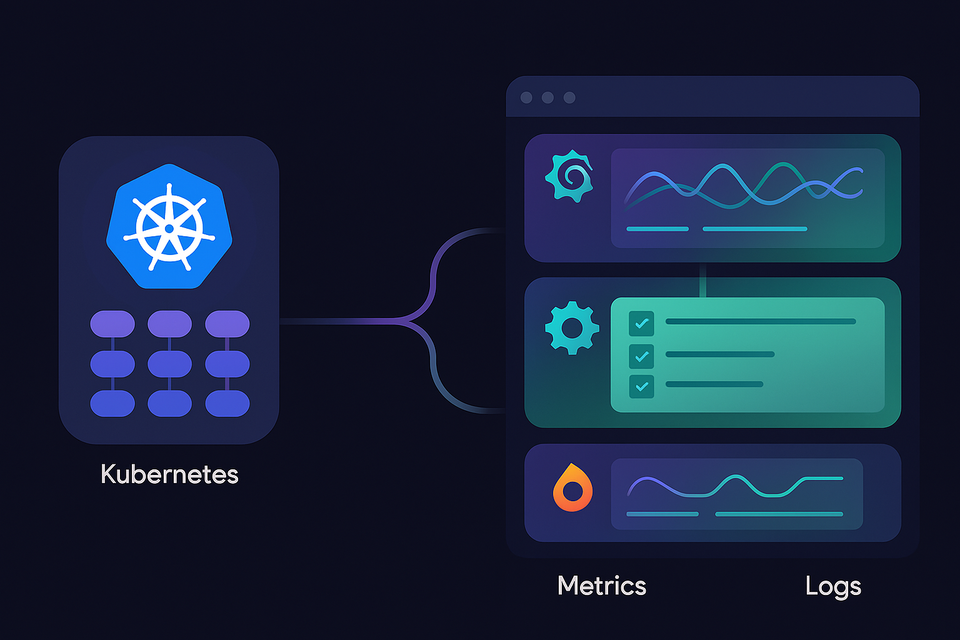
Metrics are great for knowing 'what' is happening, but often we need logs to understand 'why' something happened. This is where Grafana Loki and Alloy come in. Together, they provide a lightweight, Kubernetes-friendly log aggregation pipeline that integrates directly with our existing Grafana instance.
Why Loki + Alloy?
- Loki is a log aggregation system from Grafana Labs, designed to be cost-effective and Kubernetes-native. Unlike Elasticsearch, Loki only indexes labels, making it much lighter to run in a Home Lab.
- Alloy is Grafana's new open-source collector that acts as a replacement for Promtail and the Grafana agent. It discovers Kubernetes pods, tails their logs, and pushes them to Loki.
With these two components, we'll be able to:
- View and search pod logs directly inside Grafana.
- Correlate metrics (Prometheus) and logs (Loki) in one place.
- Troubleshoot application failures faster.
What We'll Cover
- Installing Loki in monolithic mode (simpler for Home Lab).
- Deploying Alloy to collect logs from all nodes.
- Connecting Loki as a data source in Grafana.
- Exploring logs with Grafana's Drilldown option.
Hardware / Setup Requirements
- A running Kubernetes cluster (from our previous setup).
- Monitoring stack (kube-prometheus-stack) already deployed with Grafana accessible via Ingress.
Steps to deploy Loki:
The Loki Helm chart makes installation simple. The "monolithic" mode bundles the ingester, distributor, querier, and query frontend into a single deployment.
First, we can add the Grafana Helm repo:
helm repo add grafana https://grafana.github.io/helm-charts
helm repo update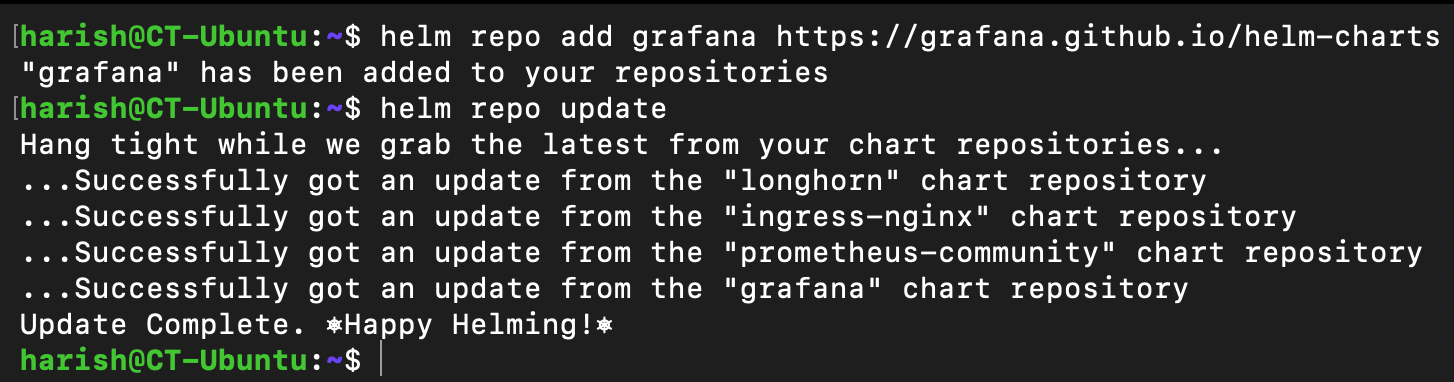
We have an existing namespace monitoring where we deployed our kube-prometheus-stack. We can use the same namespace to deploy both our Loki and Alloy components.
I'll be using the below custom values file to deploy Loki instead of using the default ones provided by the Helm chart. Feel free to change it as per your needs.
loki:
  commonConfig:
    replication_factor: 1
  storage:
    type: 'filesystem'
  schemaConfig:
    configs:
      - from: "2024-04-01"
        store: tsdb
        object_store: filesystem
        schema: v13
        index:
          prefix: loki_index_
          period: 24h
  pattern_ingester:
    enabled: true
  limits_config:
    allow_structured_metadata: true
    volume_enabled: true
  ruler:
    enable_api: true
  auth_enabled: false

minio:
  enabled: false

deploymentMode: SingleBinary

singleBinary:
  replicas: 1
  persistence:
    storageClass: longhorn
    accessModes:
      - ReadWriteOnce
    size: 5Gi

backend:
  replicas: 0
read:
  replicas: 0
write:
  replicas: 0

chunksCache:
allocatedMemory: 500We can now deploy Loki in the monitoring namespace with this custom values file:
helm install loki grafana/loki -n monitoring -f loki-values.yaml
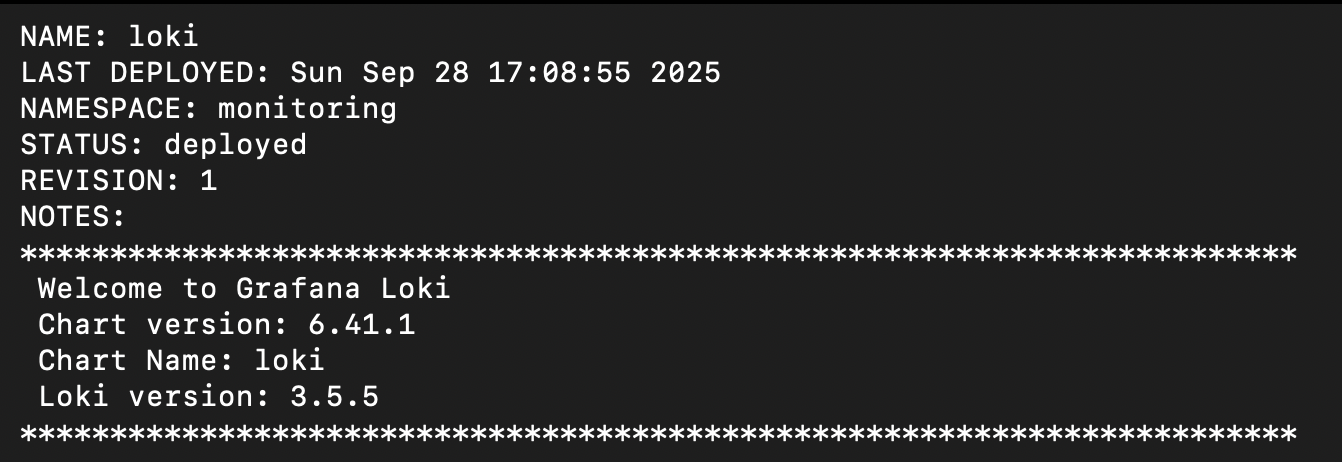
We have successfully deployed Loki. Give it a few minutes for all the pods to spin up successfully. We can also check the same.
kubectl get pods -n monitoring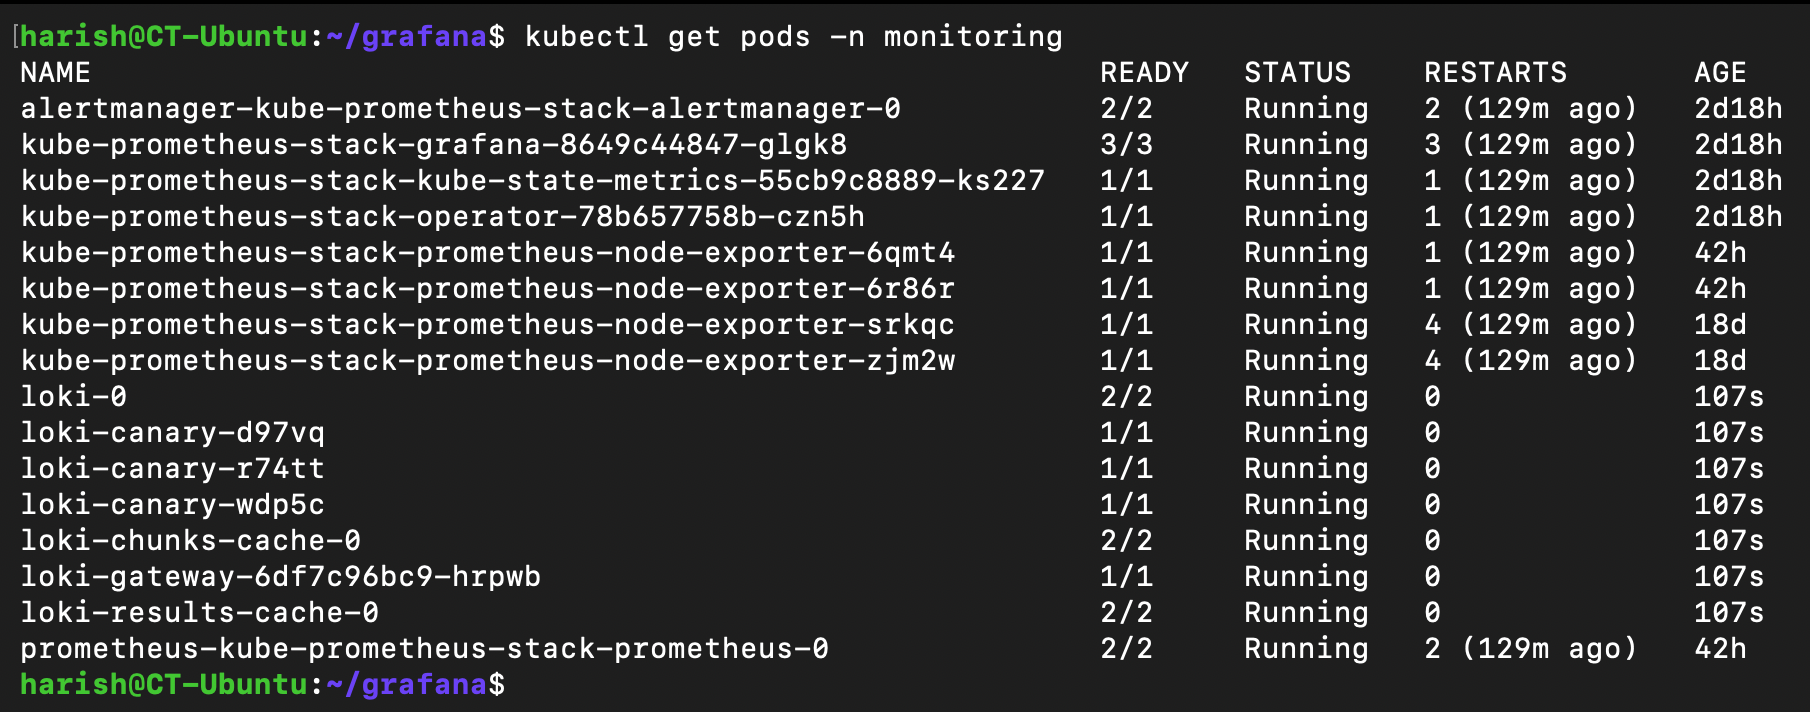
Here we can see that all the pods from the Helm chart have been deployed and are running successfully. Since we have configured our persistence storage using Longhorn, we would be able to see the same in our Longhorn instance UI.
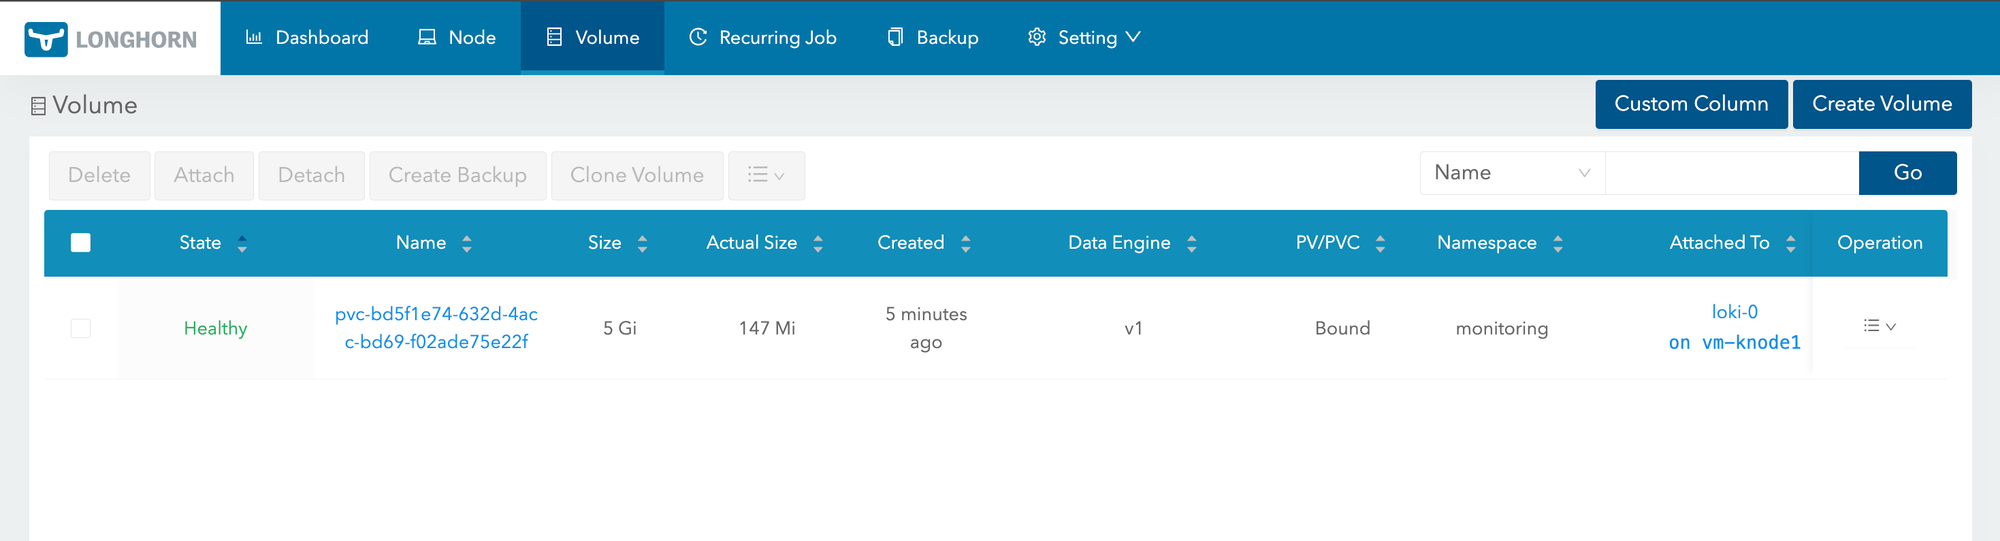
We have now successfully deployed Loki in our Home Lab.
Steps to deploy Alloy:
Alloy will run on each node as a Daemonset, tail container logs, and push them to Loki. We will be deploying Alloy via Helm chart.
Here again, I'll be using a custom values file to deploy Alloy. This custom values file will have the pods discovery & rewrite rules for proper naming conventions, log collection, and the URL of the Loki instance to which Alloy would need to forward the data.
alloy:
  configMap:
    content: |-
      logging {
        level = "debug"
        format = "logfmt"
      }
      discovery.kubernetes "pods" {
        role = "pod"
      }
      discovery.relabel "pods" {
        targets = discovery.kubernetes.pods.targets

        rule {
          source_labels = ["__meta_kubernetes_namespace"]
          target_label = "namespace"
          action = "replace"
        }

        rule {
          source_labels = ["__meta_kubernetes_pod_label_app_kubernetes_io_name"]
          target_label = "app"
          action = "replace"
        }

        rule {
          source_labels = ["__meta_kubernetes_pod_container_name"]
          target_label = "container"
          action = "replace"
        }

        rule {
          source_labels = ["__meta_kubernetes_pod_name"]
          target_label = "pod"
          action = "replace"
        }
      }
      loki.source.kubernetes "pods" {
        targets    = discovery.relabel.pods.output
        forward_to = [loki.process.process.receiver]
      }
      loki.process "process" {
        forward_to = [loki.write.loki.receiver]

        stage.match {
          selector = "{instance=~\".*\"}"
          stage.json {
            expressions = {
              level = "\"level\"",
            }
          }
          stage.labels {
            values = {
              level = "level",
            }
          }
        }
        stage.label_drop {
          values = [ "service_name" ]
        }
      }
      loki.write "loki" {
        endpoint {
          url = "http://loki-gateway/loki/api/v1/push"
        }
      }
  mounts:
    varlog: true
dockercontainers: trueloki.write block specifies the loki's endpoint where the data will be sent. Make sure to change this based upon your loki installation.We can now deploy Alloy in the monitoring namespace with this custom values file:
helm install alloy grafana/alloy -n monitoring -f alloy-values.yaml
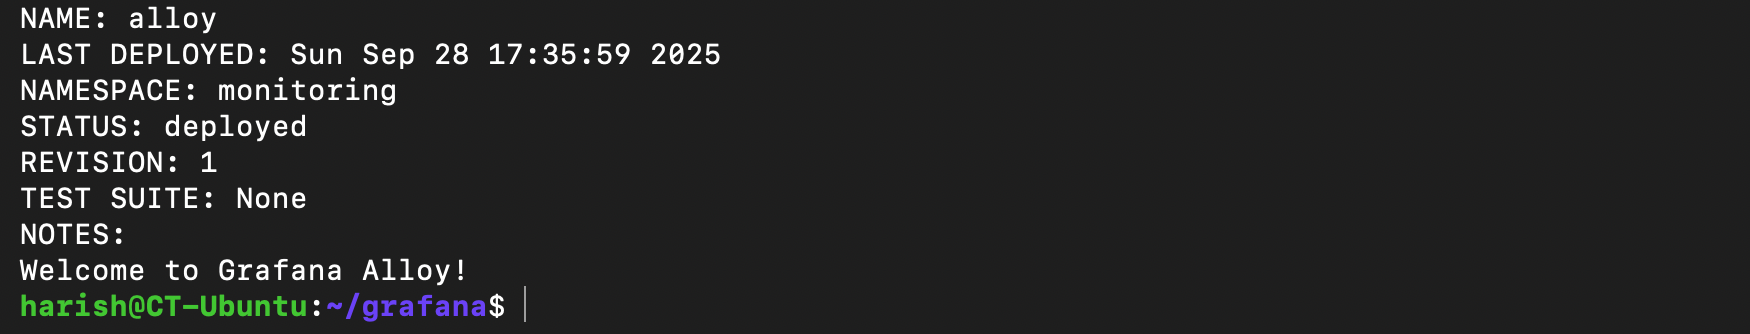
We have now successfully deployed Alloy.
kubectl get pods -n monitoring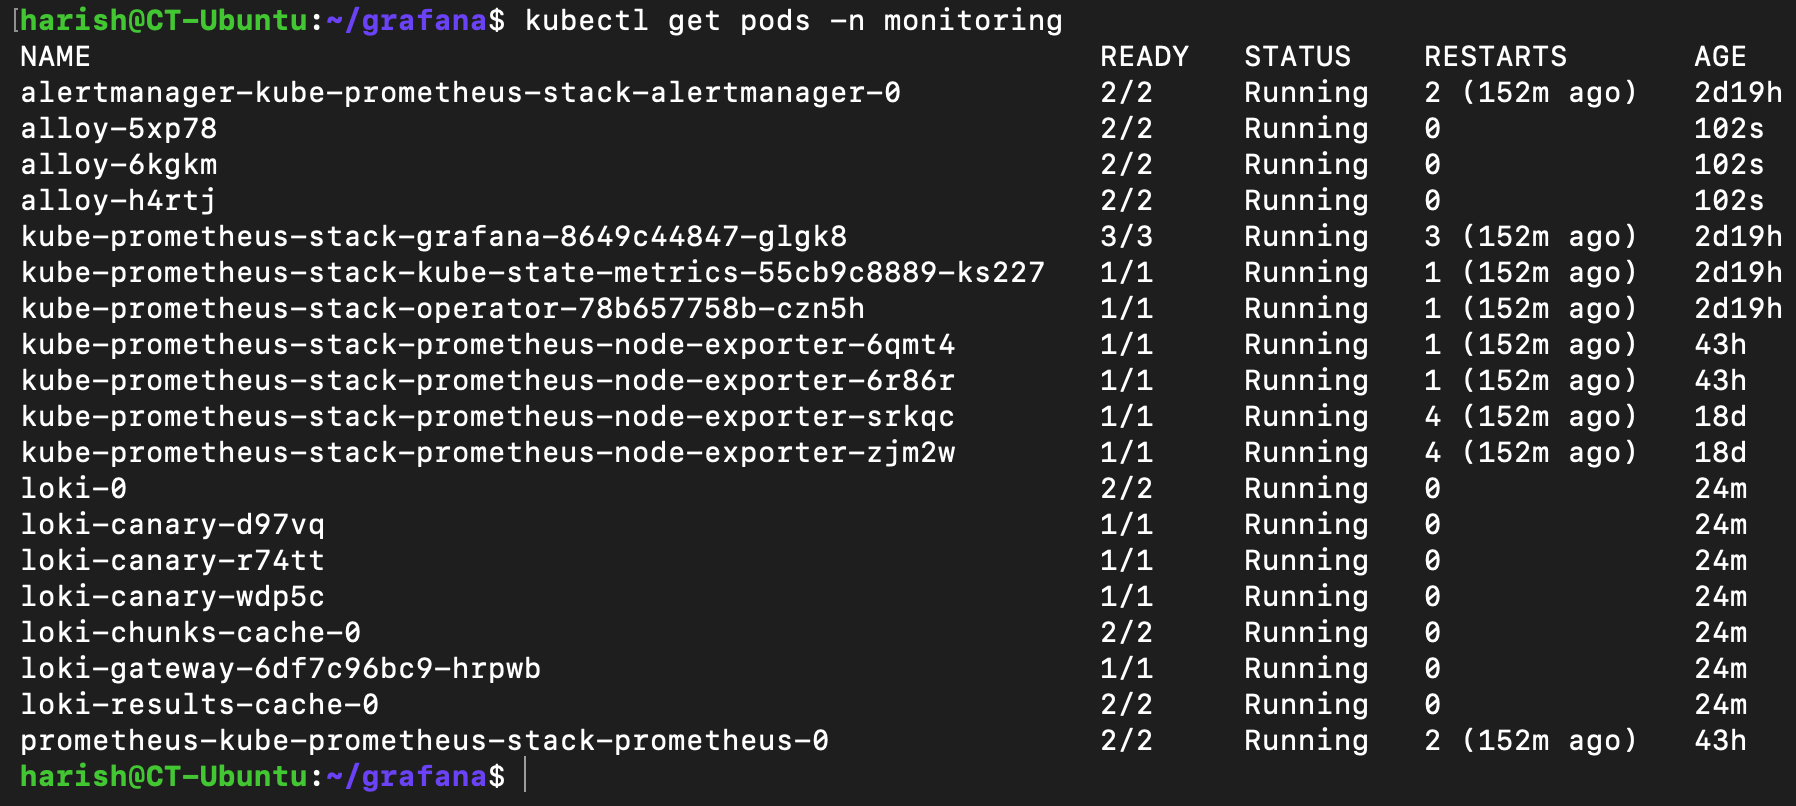
Alloy will now collect logs from every pod and forward them to Loki.
Configuring Grafana:
Since we already have Grafana running in our monitoring namespace, we just need to tell Grafana about Loki.
We can log in to Grafana.
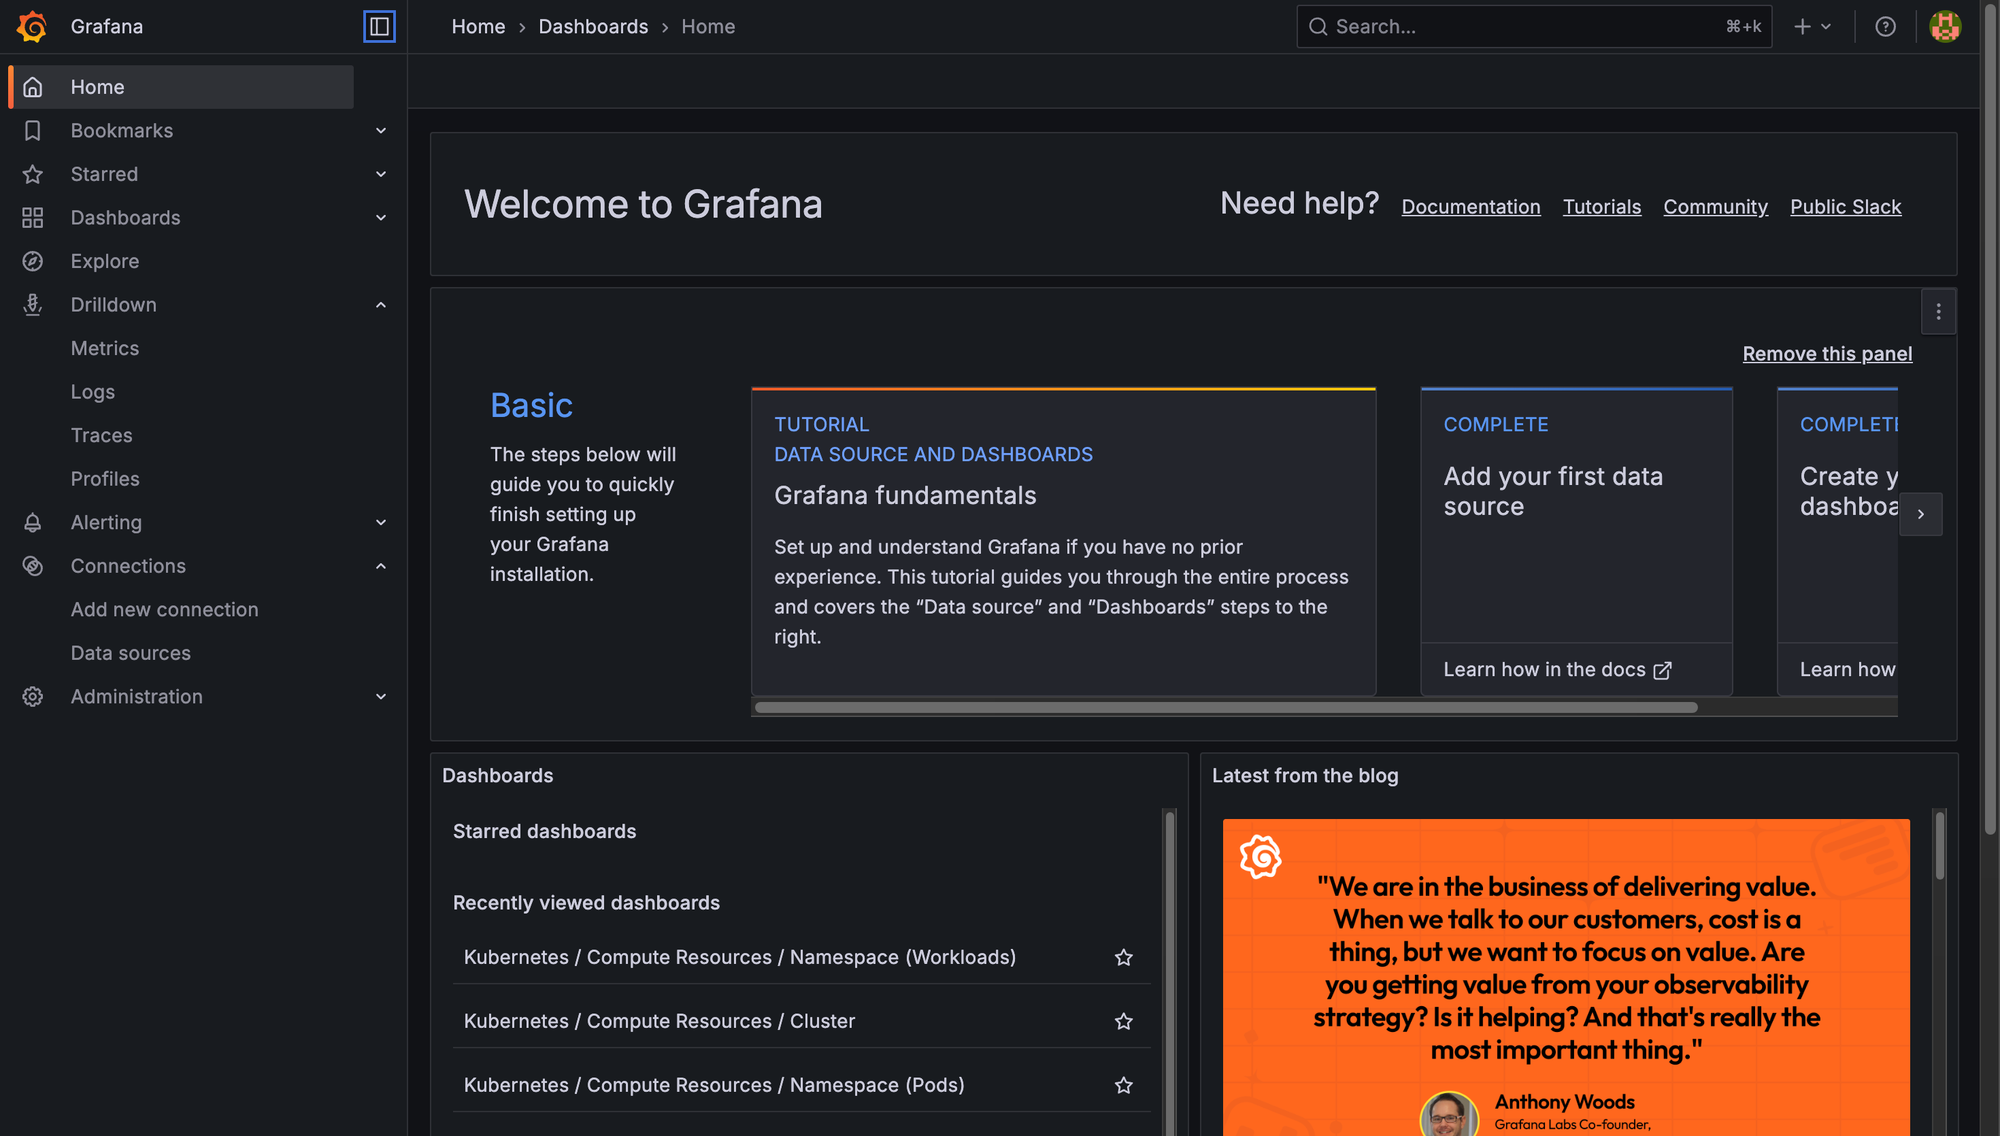
Head to Connections -> Data Sources -> Add Data Source.
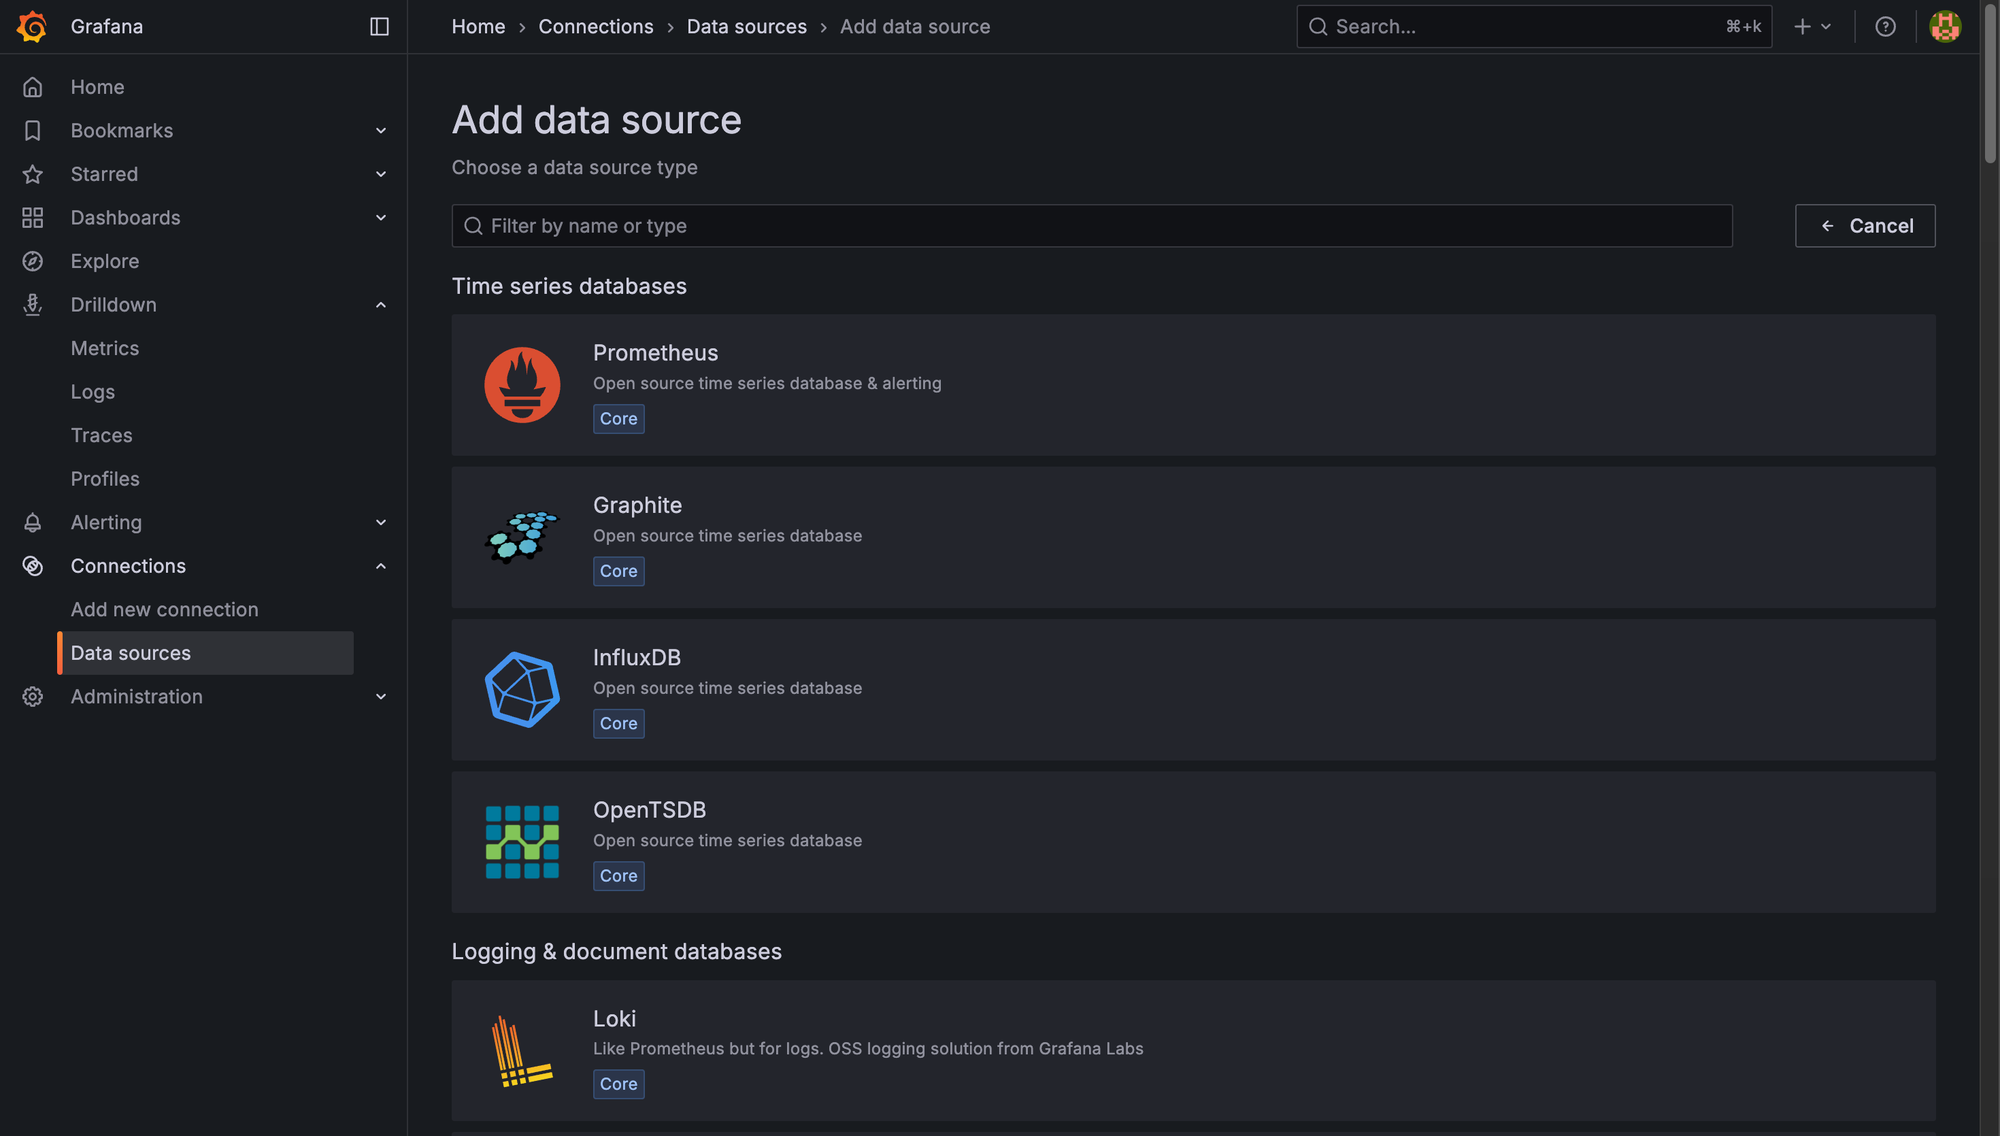
Select Loki and enter the URL of our Loki instance.
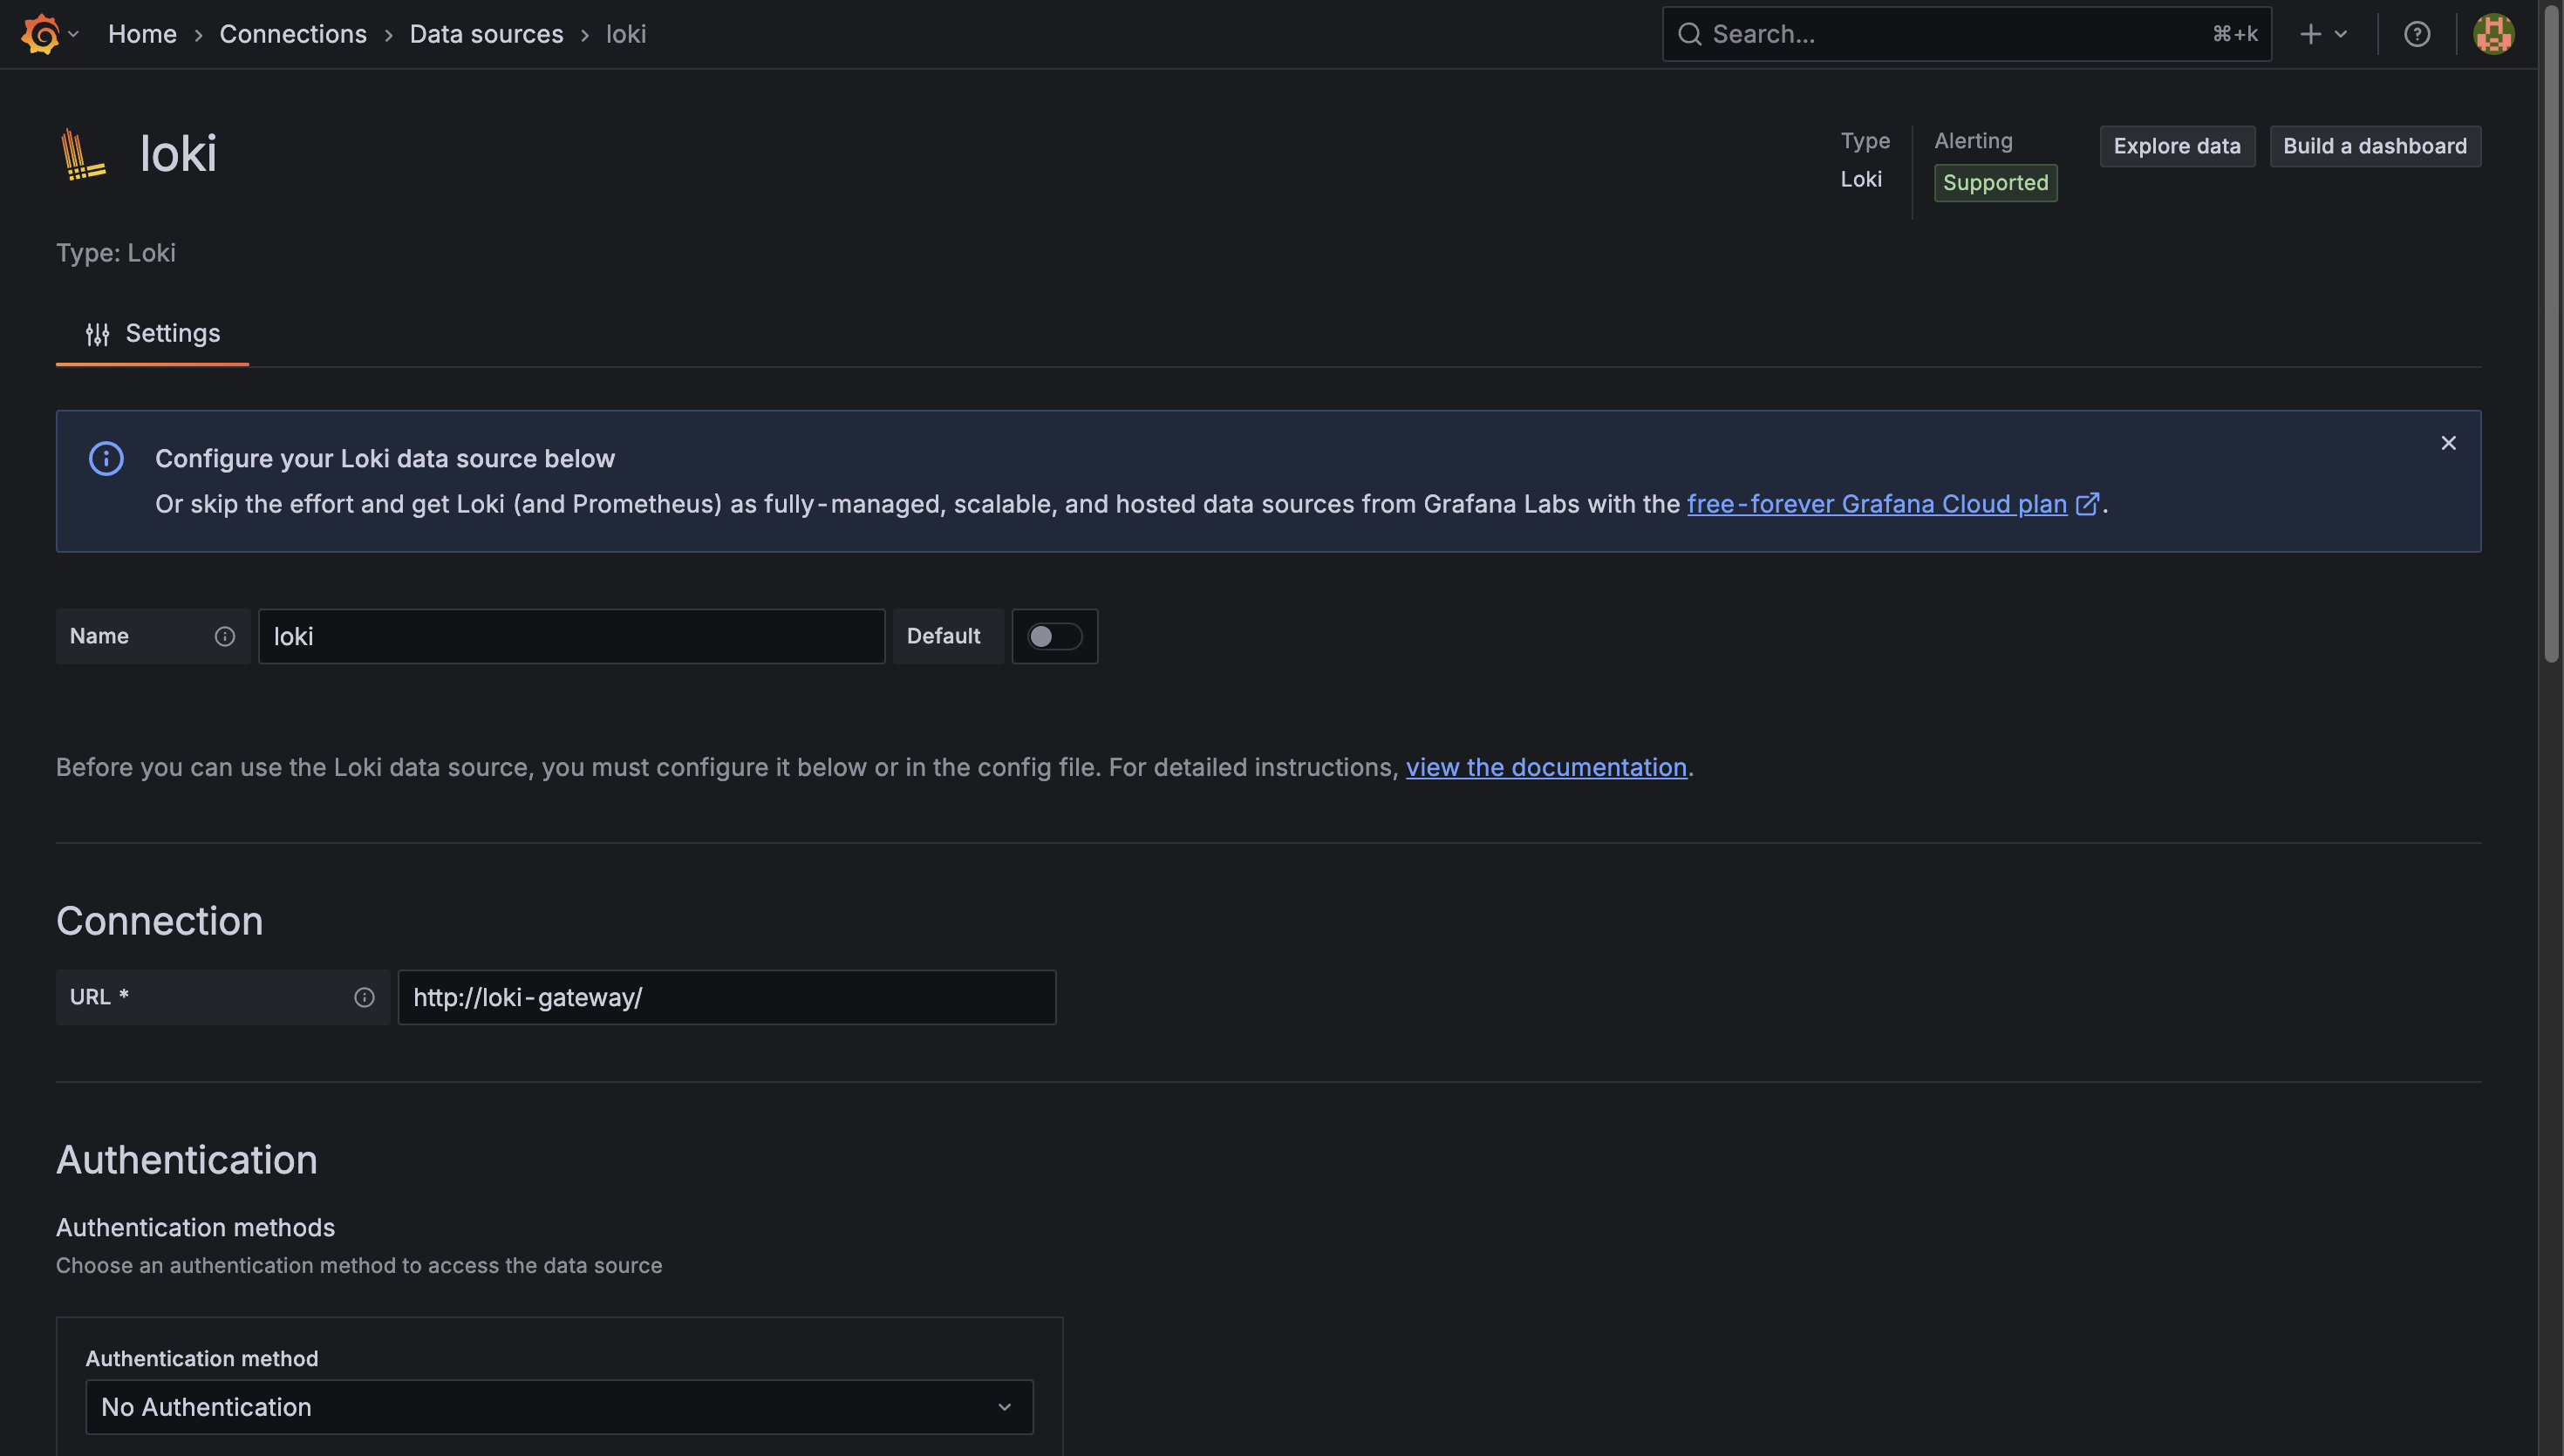
We can click on Save & Test to test if our connection works fine.
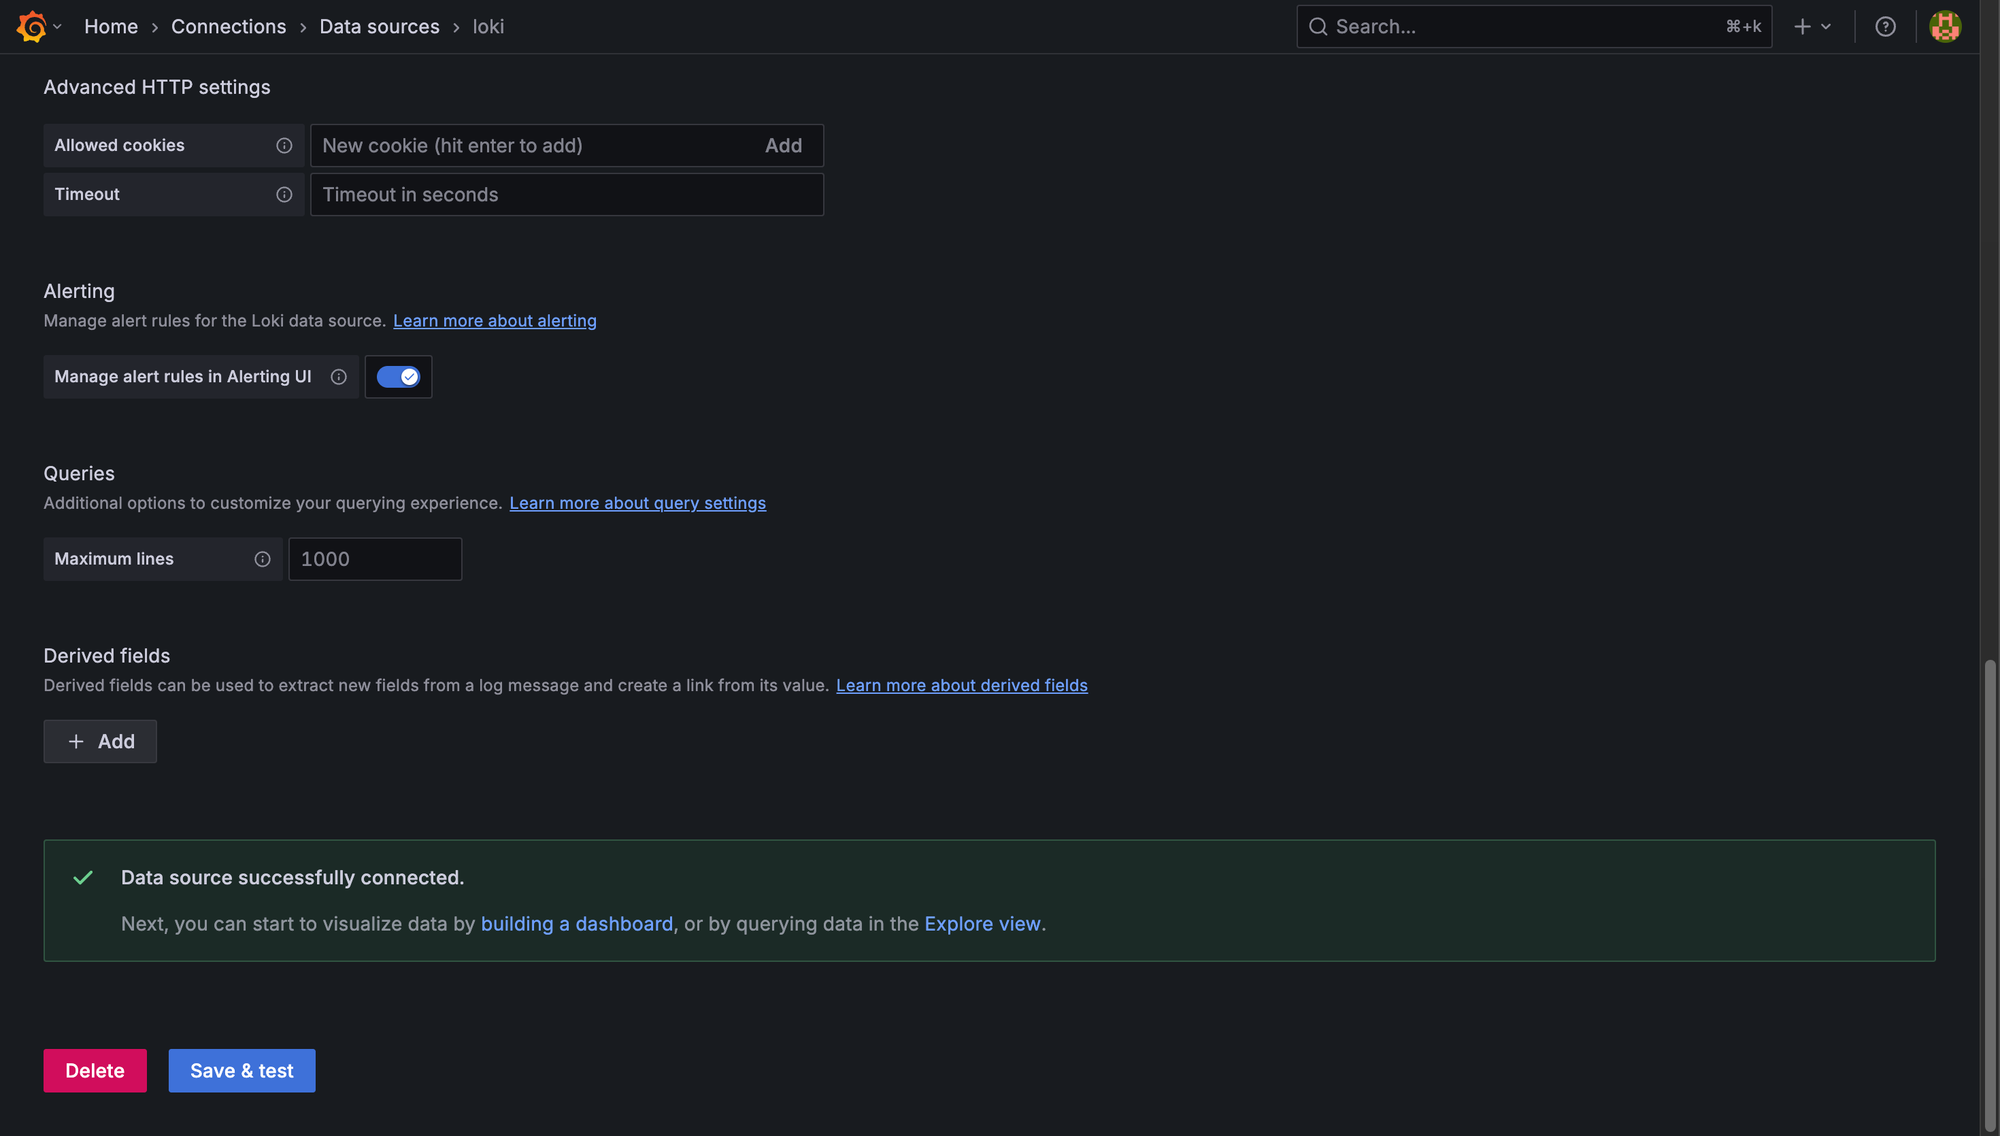
Grafana confirms that it can talk to our Loki instance. We have now successfully configured our Grafana instance to talk to Loki.
Exploring Logs:
Now comes the fun part!
We can go to Drilldown in Grafana's left sidebar.
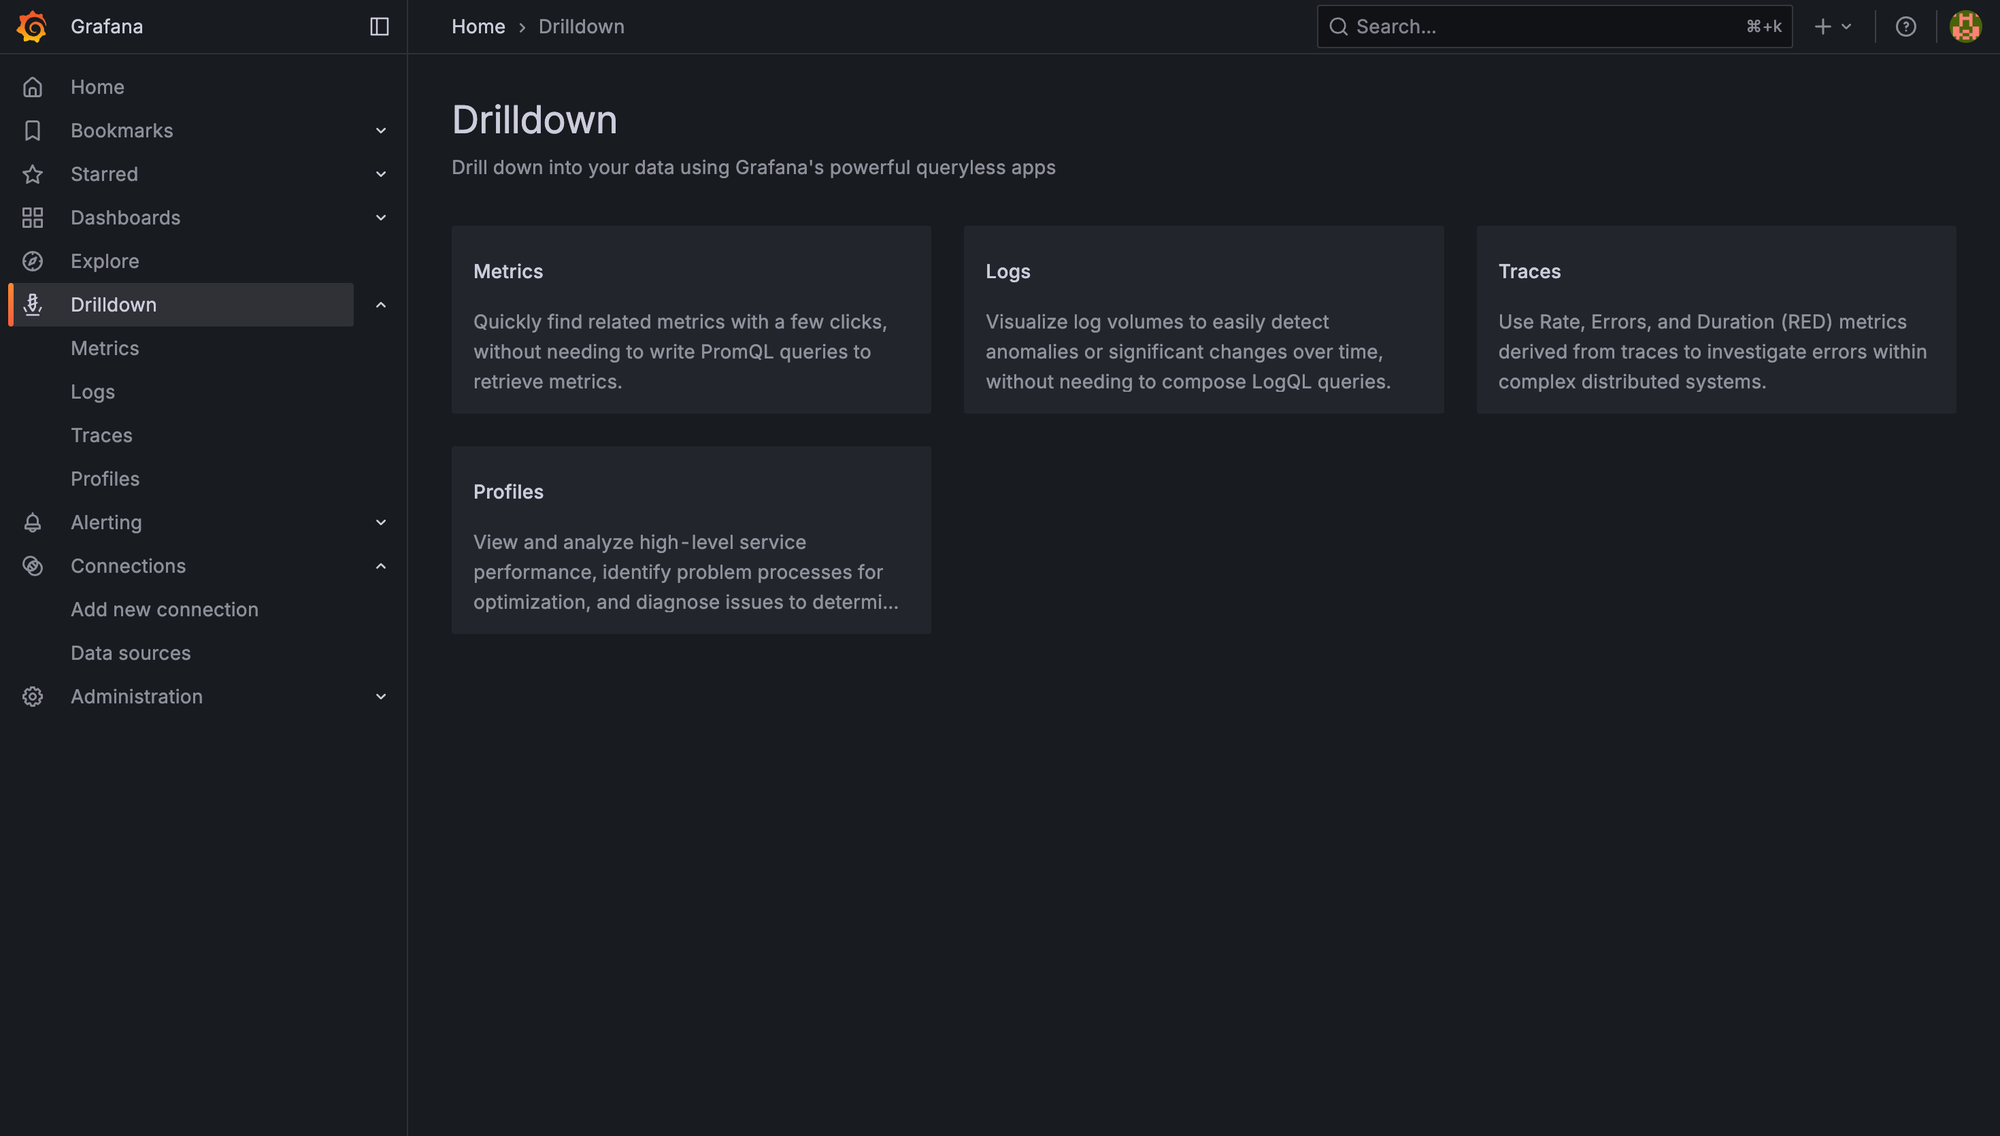
Click on the Logs option, and we can see all the pods running in our cluster.
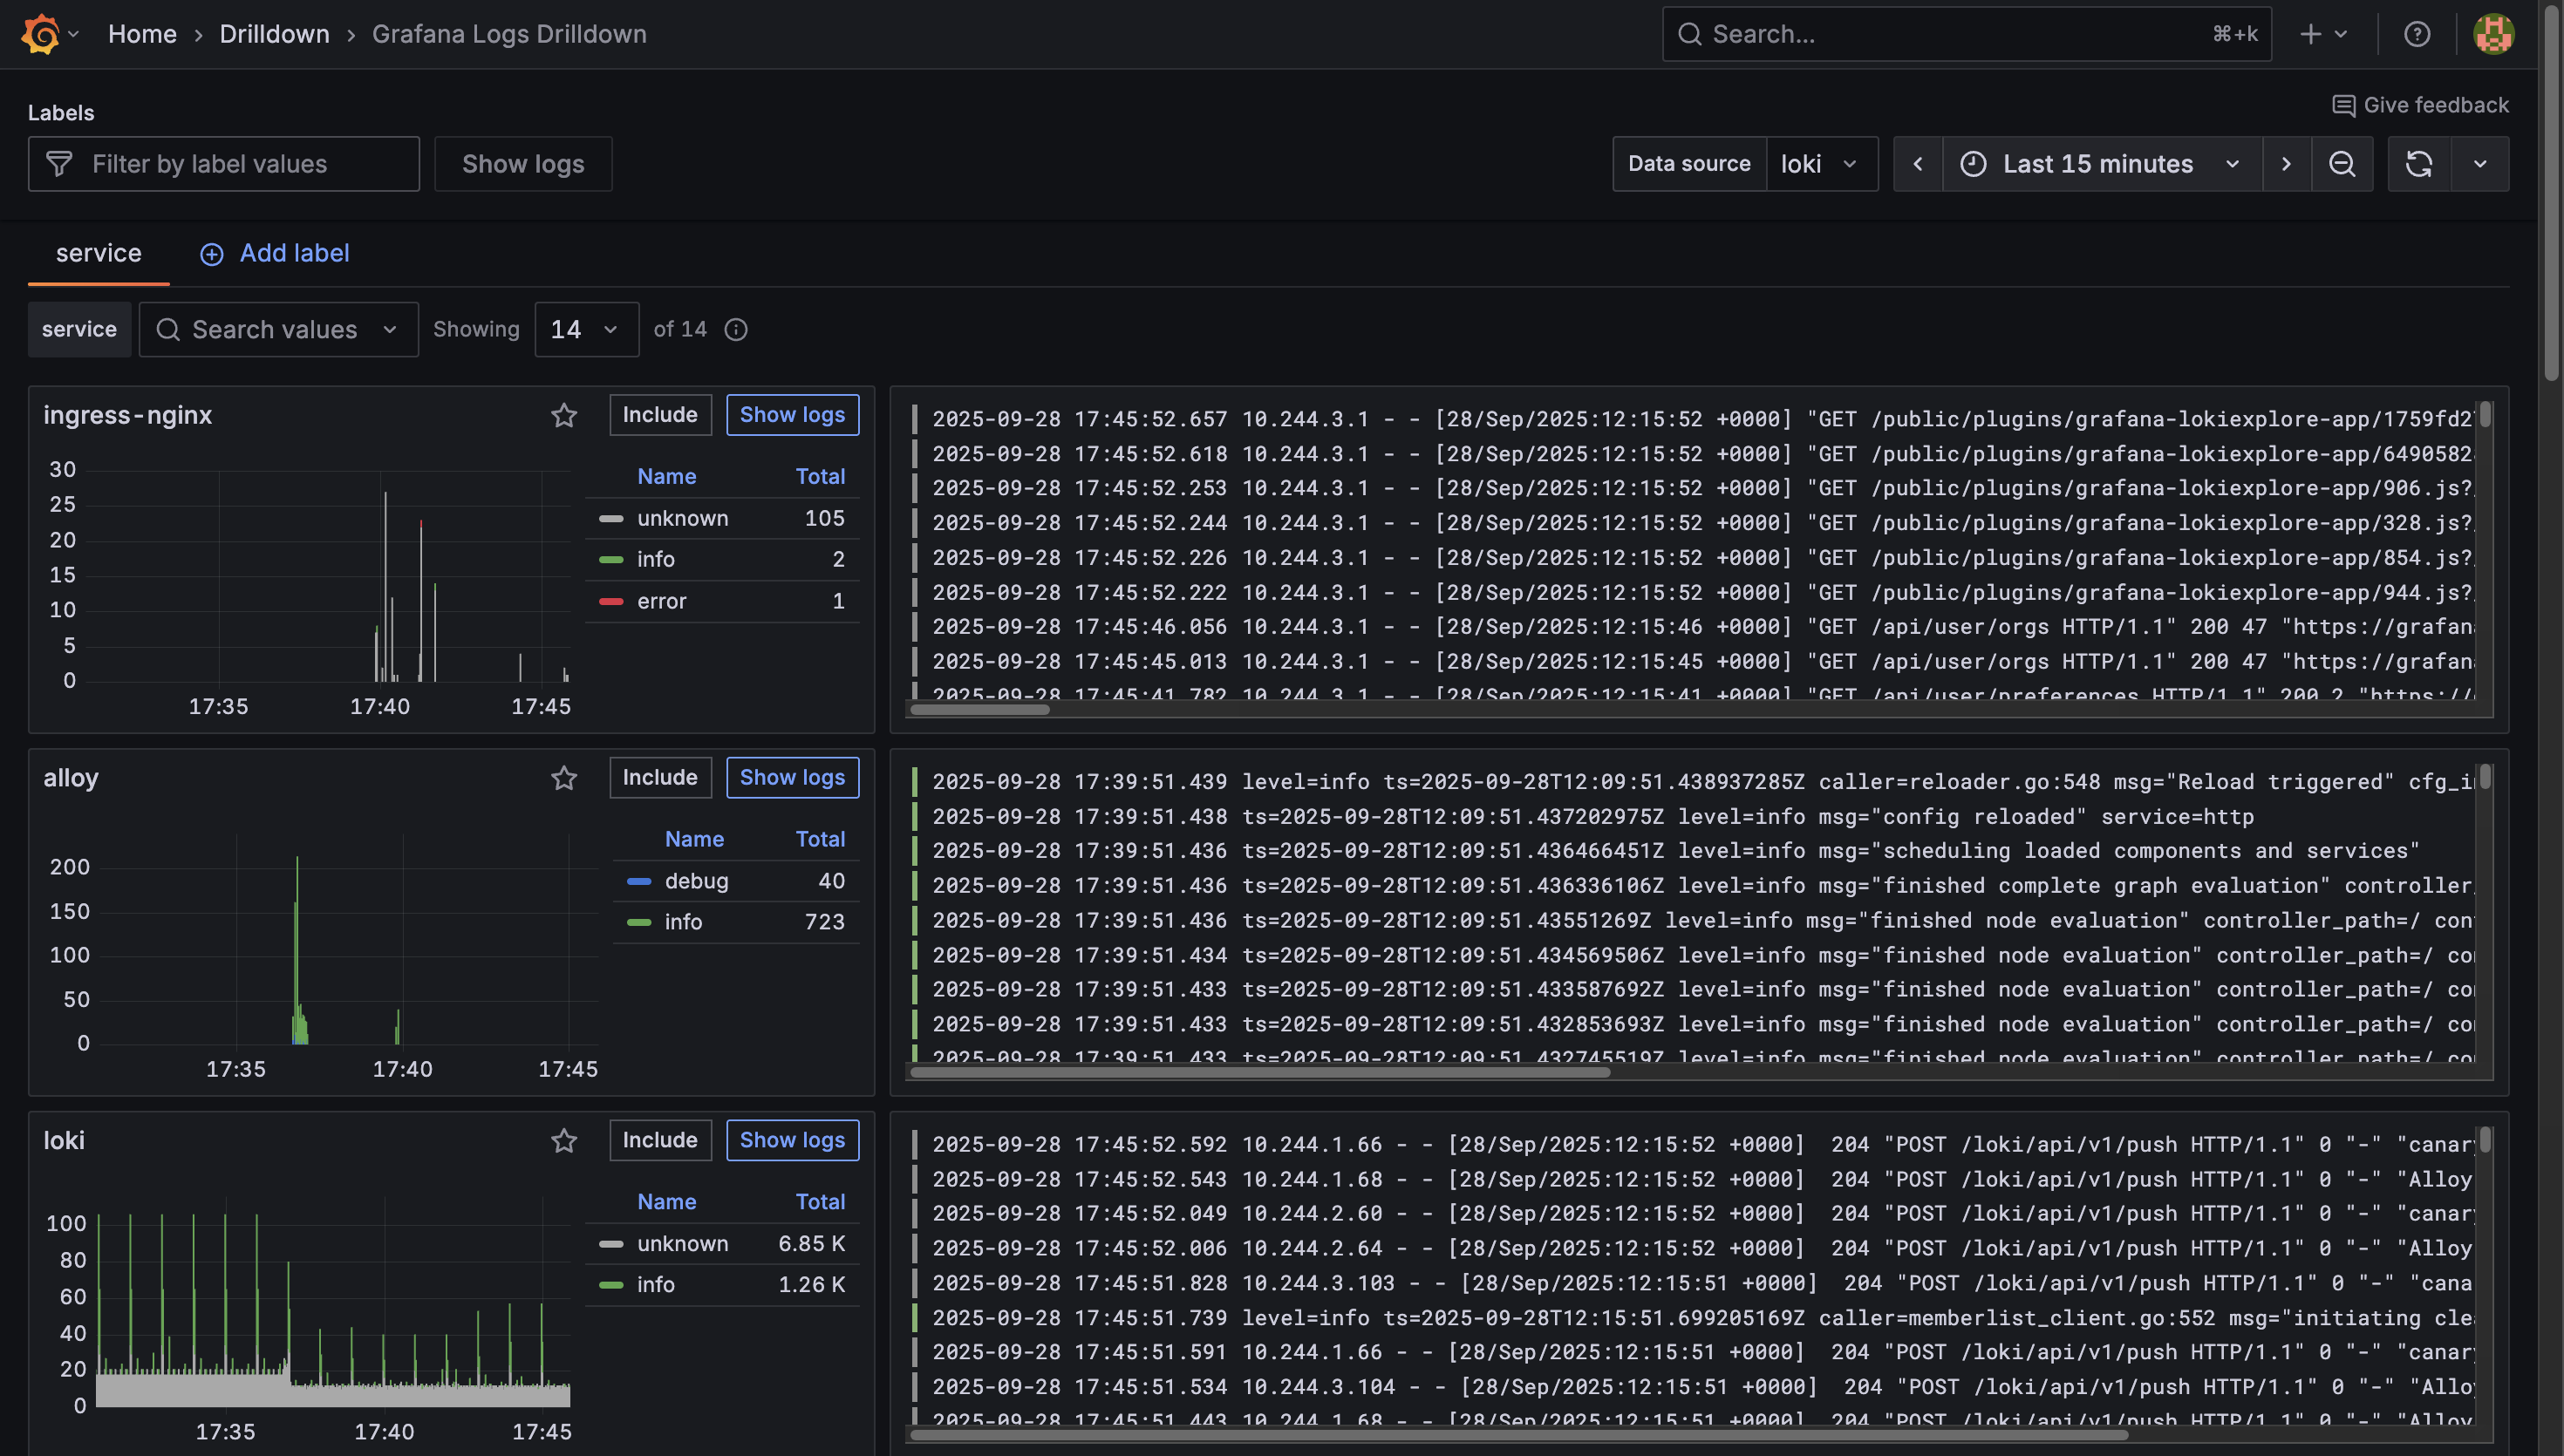
We can click on the Show Logs button on any of the pods to view the logs in detail.
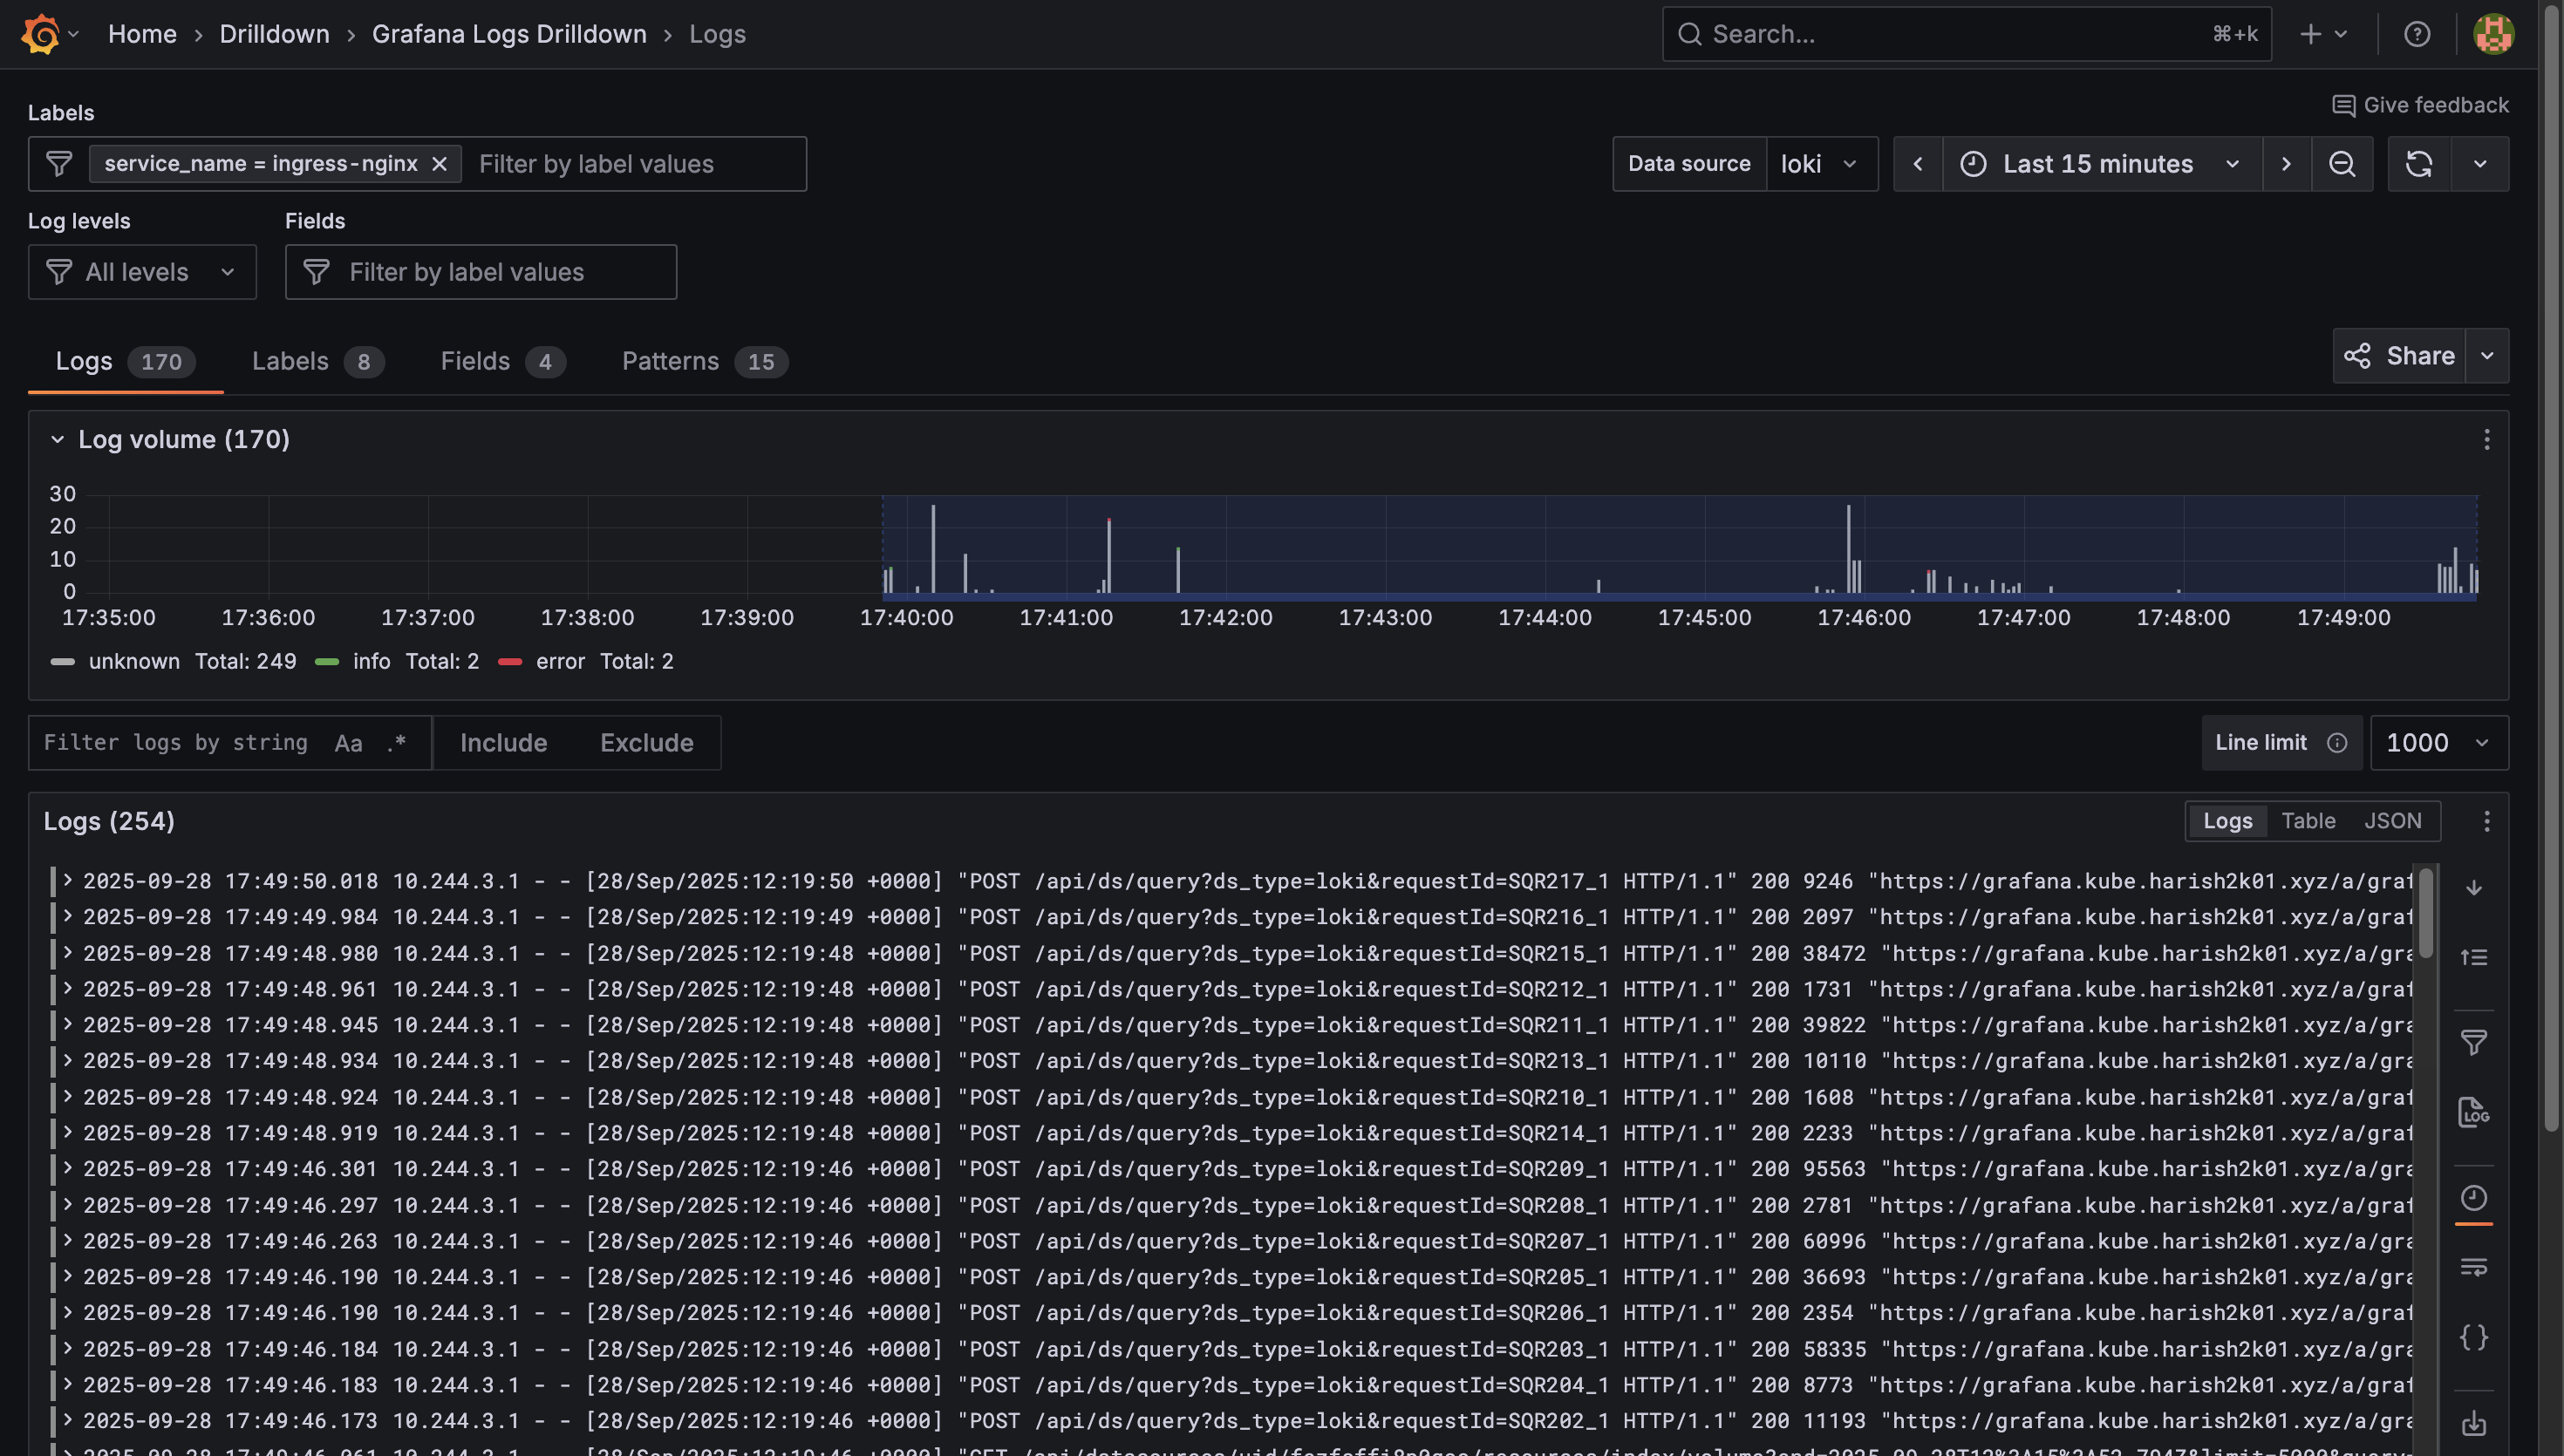
We'll now be able to see real-time logs from our pods, searchable and filterable. The best part is that if we are able to notice any CPU spikes for a particular pod, we will now be able to switch to the pod's logs to check on the same without leaving Grafana.
In this article, we:
- Installed Loki in monolithic mode for log storage.
- Deployed Alloy as a Kubernetes log collector.
- Integrated Loki into our existing Grafana.
- Explored Kubernetes logs seamlessly alongside metrics.
With logs and metrics under one roof, our Kubernetes Home Lab has gone from "flying blind" to a fully observable system.
In the next article, we will be looking into another service that we will be deploying in our Home Lab. Stay tuned for more detailed instructions on expanding our Home Labbing capabilities.
Happy Homelabbing!!!
References:


Member discussion