Introducing K9s: Terminal-based Kubernetes Dashboard
In our previous article, we walked through the installation and configuration of a Kubernetes cluster on a bare-metal server right from scratch.
Now, it's time to look at how we can manage it more efficiently. While kubectl is a powerful tool, it can be a little overwhelming.
That's where K9s come into play. It is a lightweight, terminal-based dashboard that makes Kubernetes management fast and interactive.
What is K9s?
K9s is an open-source terminal UI that simplifies the process of interacting with your Kubernetes clusters. It gives us a live, keyboard-driven interface where we can view, inspect, and manage our cluster resources.
It is built on top of kubectl and wraps it in a clean, fast, and intuitive user interface, making it easier to monitor and debug our cluster.
Key features of K9s:
- Live View of Our Cluster
- Quick Pod Navigation
- Instant Logs & Exec Access
- Filtering & Search
- Lightweight & Portable
Steps to install K9s:
- I'll be installing K9s on my control plane node, where I'll usually check up on my cluster.
- First and foremost, we need to download the latest tarball version of the K9s binary from their official repository - K9s Releases.
- Make sure to download the binary that supports your system from where you usually access your cluster. Mine is an Ubuntu server, so I'll be downloading the Linux tarball variant from the releases.
wget https://github.com/derailed/k9s/releases/download/v0.50.9/k9s_Linux_amd64.tar.gz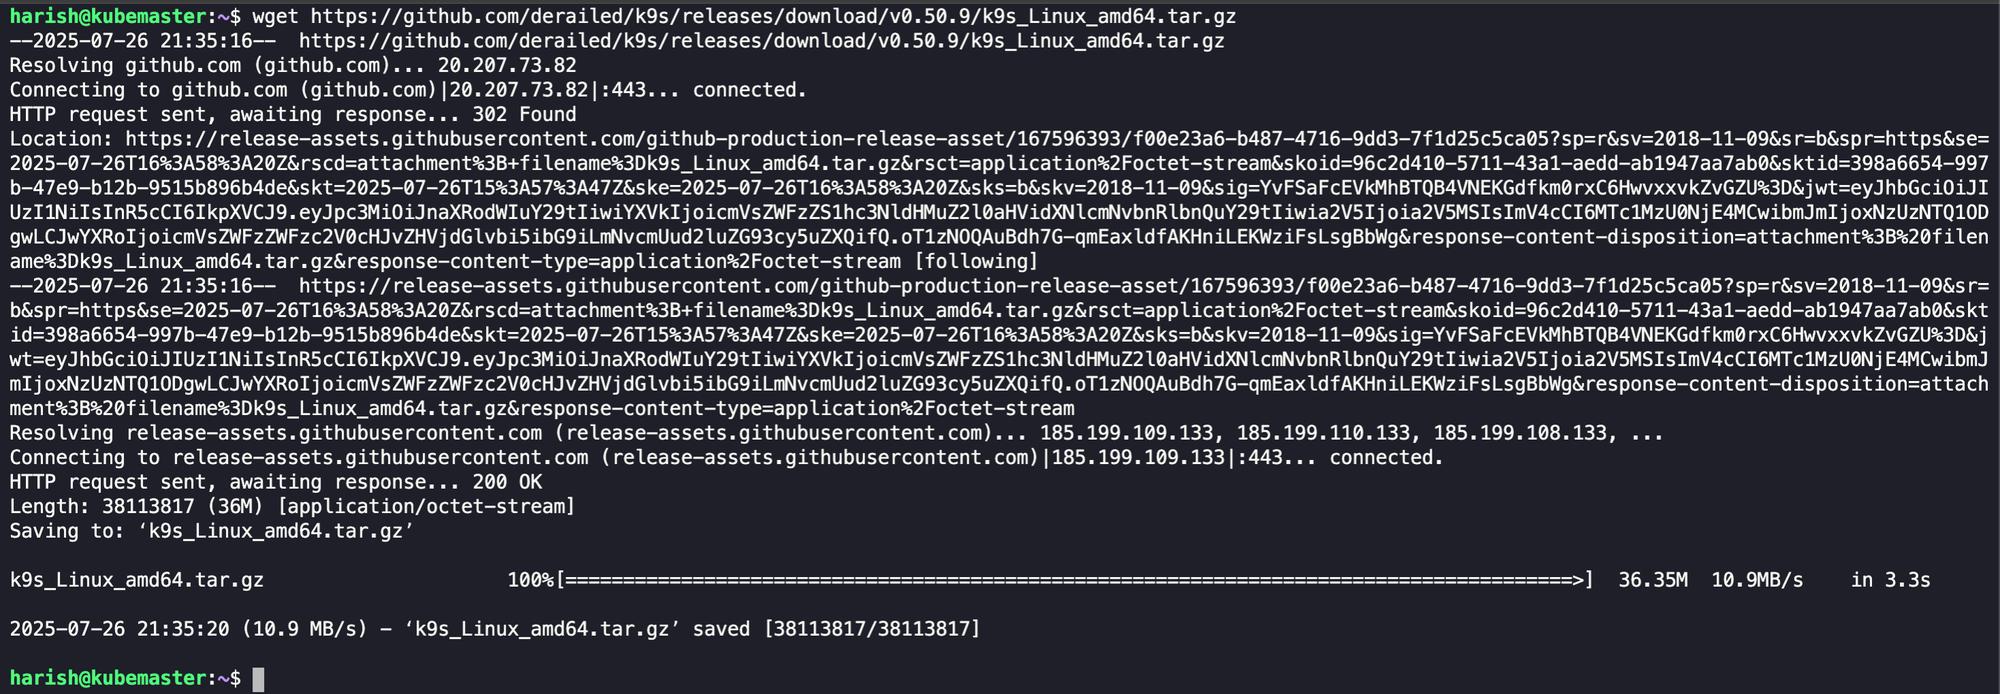
- We now need to extract the file so that we can access it using the command line.
tar -xzvf k9s_Linux_amd64.tar.gz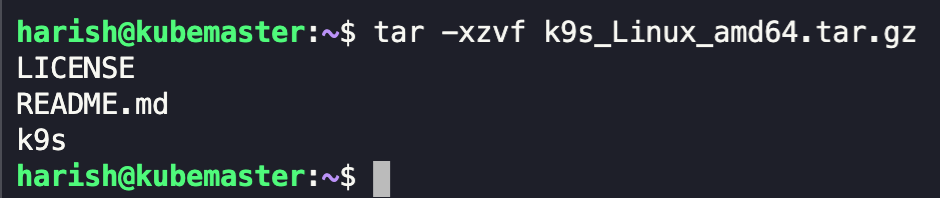
- I'll move this downloaded K9s file to the
/usr/bindirectory so that we'll be able to access it directly via the commandk9s.
sudo mv ./k9s /usr/bin/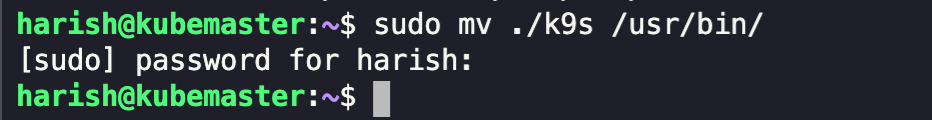
- We'll now be able to access the k9s by simply typing the same.
k9s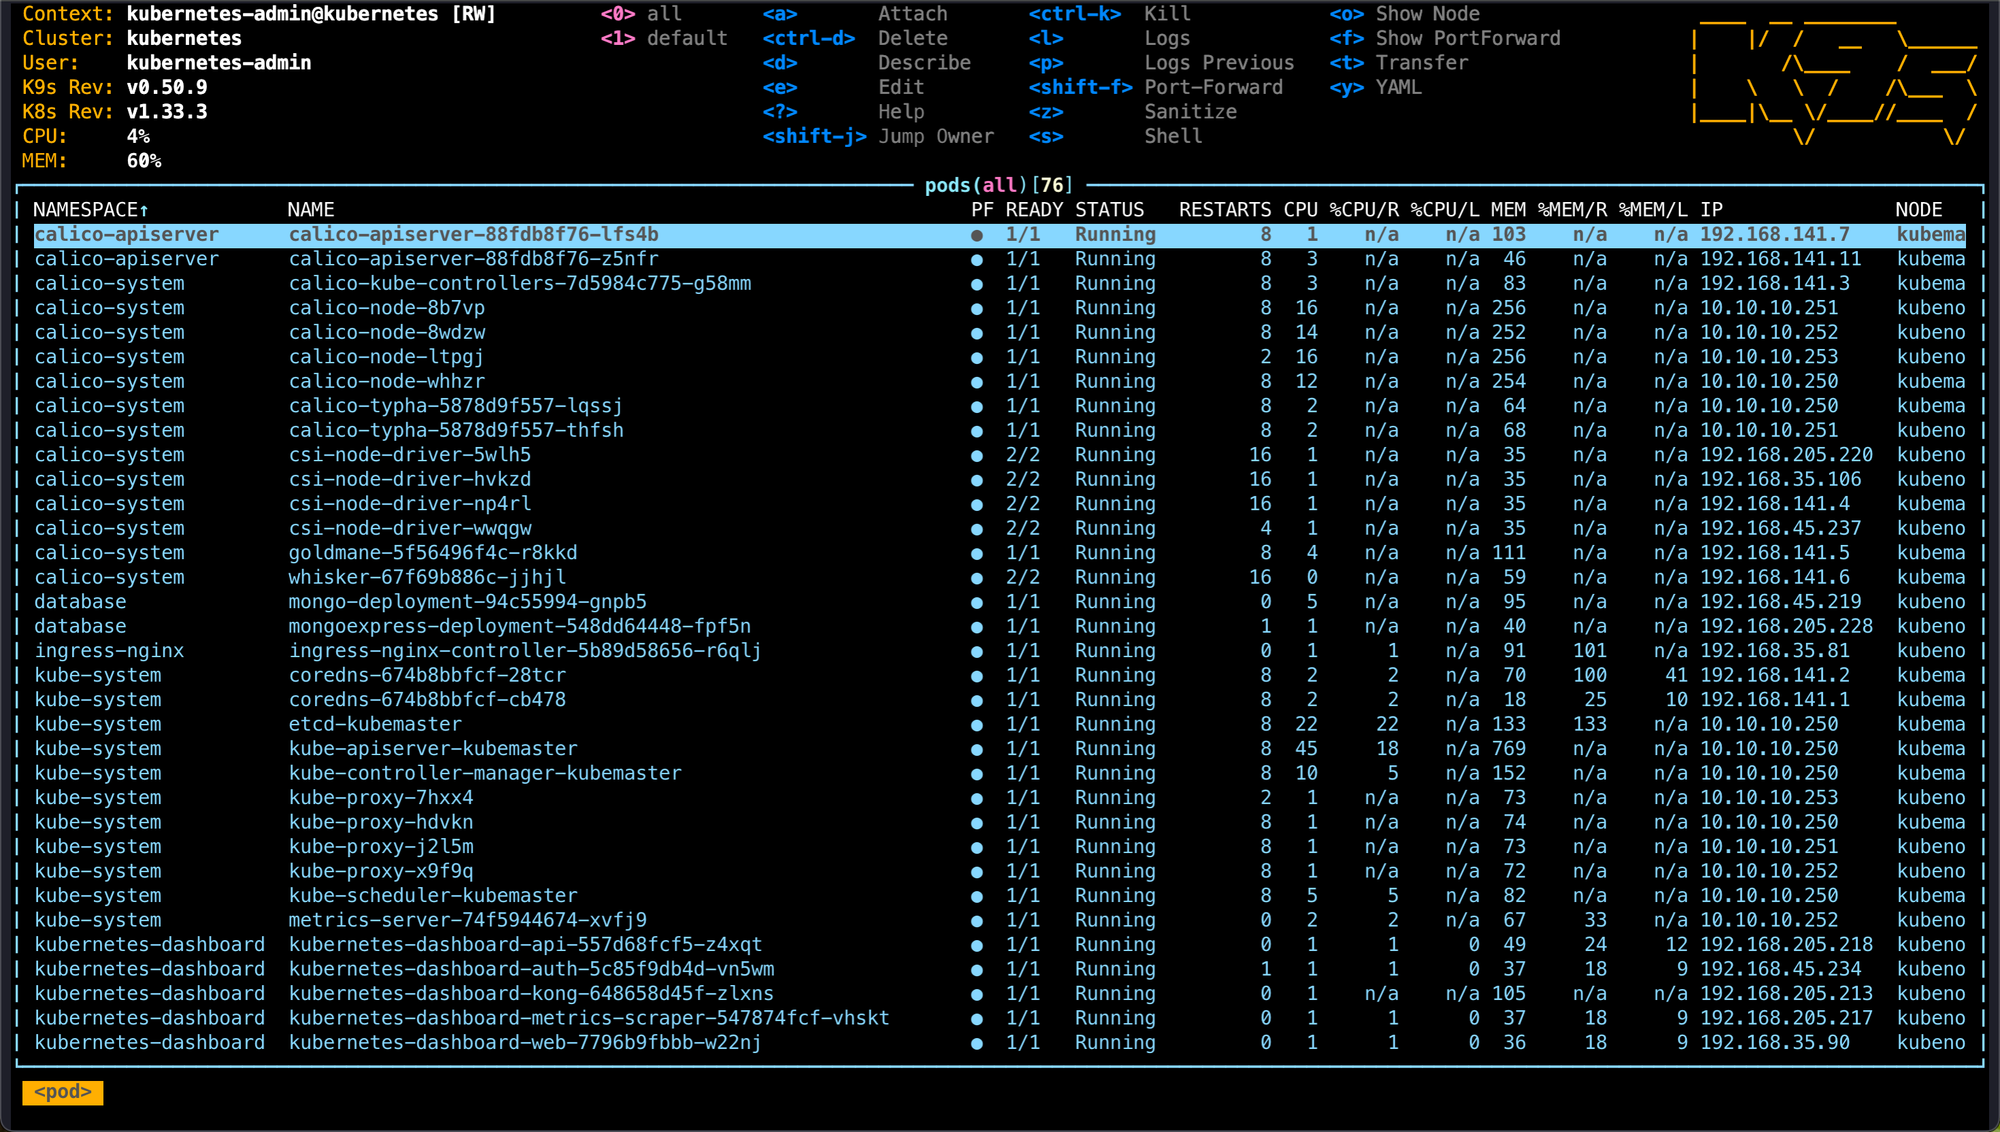
We have now successfully downloaded and configured K9s and are able to access our cluster using the same.
Exploring the K9s Interface:
Once we've installed and launched k9s, we'll be greeted with the above screen, which is a real-time view of our cluster's current state. Here's a quick look at how to navigate k9s using various keyboard shortcuts:
/- Filter the current view:- Open the command prompt to switch views (eg.,:pofor pods,:svcfor services)d- Describe a resourcel- View logss- Exec into a podctrl+a- Switch between all namespaces and defaultq- Quit the current view or exit
We can scroll through resources, watch status changes in real time, and take actions without ever touching our mouse.
In this article, we explored K9s, and went into the step-by-step process of installing the same. We also took a peek at the commonly used keyboard shortcuts.
In the next article, we will be looking into another service that we will be deploying in our Home Lab. Stay tuned for more detailed instructions on expanding our Home Labbing capabilities.
Happy Homelabbing!!!


Member discussion