Monitoring Kubernetes with Prometheus and Grafana
In our previous article, we set up Longhorn to give our Kubernetes cluster reliable and persistent storage.
With networking, ingress, and storage sorted out, the next essential component to think about is monitoring and observability.
A Kubernetes cluster without monitoring is like flying blind - we won't know the health of our nodes, pods, or workloads until something breaks. That's where Prometheus and Grafana come in, and the easiest way to get them running is through the kube-prometheus-stack Helm chart.
Why Kube-Prometheus-Stack?
The kube-prometheus-stack is a community-maintained Helm chart that bundles:
- Prometheus - To collect metrics from Kubernetes and workloads
- Grafana - To visualize metrics with powerful dashboards
- Alertmanager - To notify us when things go wrong
- Node Exporter - To expose Kubernetes and system metrics
In short, it's a complete "plug-and-play" monitoring solution that integrates tightly with Kubernetes.
For a Home Lab, this is extremely useful because:
- We can keep an eye on resource usage
- Troubleshoot pod restarts or crashes
- Get alerts if a node or service goes down
- And, let's be honest - We get to stare at cool Grafana dashboards
What We'll Cover
- Installing kube-prometheus-stack with Helm
- Accessing the Grafana dashboard
- Setting up ingress for Grafana
- Exploring the default dashboards and metrics
Hardware / Setup Requirements
- A working Kubernetes cluster (from our previous articles)
- MetalLB + NGINX Ingress Controller (already configured in our setup)
Steps to deploy kube-prometheus-stack:
The kube-prometheus-stack is available as a Helm chart from the prometheus-community repo.
- First, let's add the repo and update it.
helm repo add prometheus-community https://prometheus-community.github.io/helm-charts
helm repo update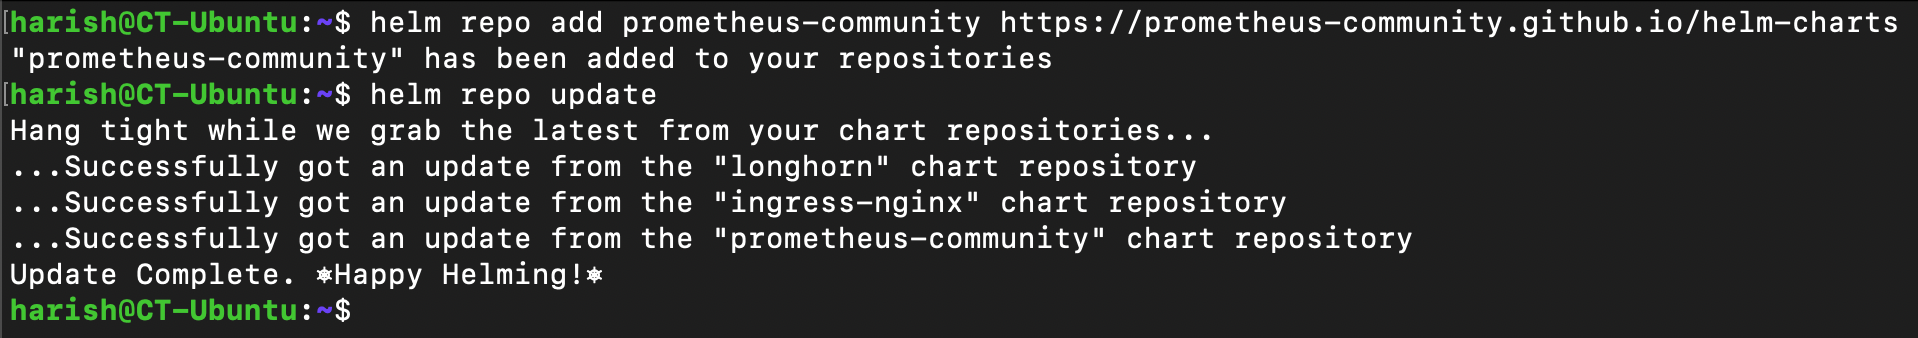
- Now, we can create a namespace monitoring to install the chart.
kubectl create namespace monitoring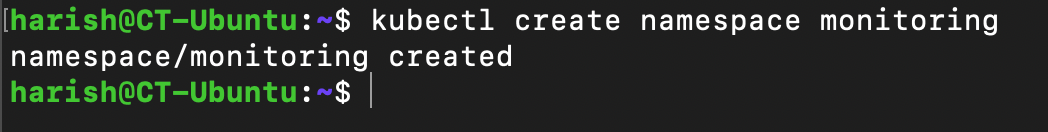
- We can now install the chart into its own namespace.
helm install kube-prometheus-stack prometheus-community/kube-prometheus-stack --namespace monitoring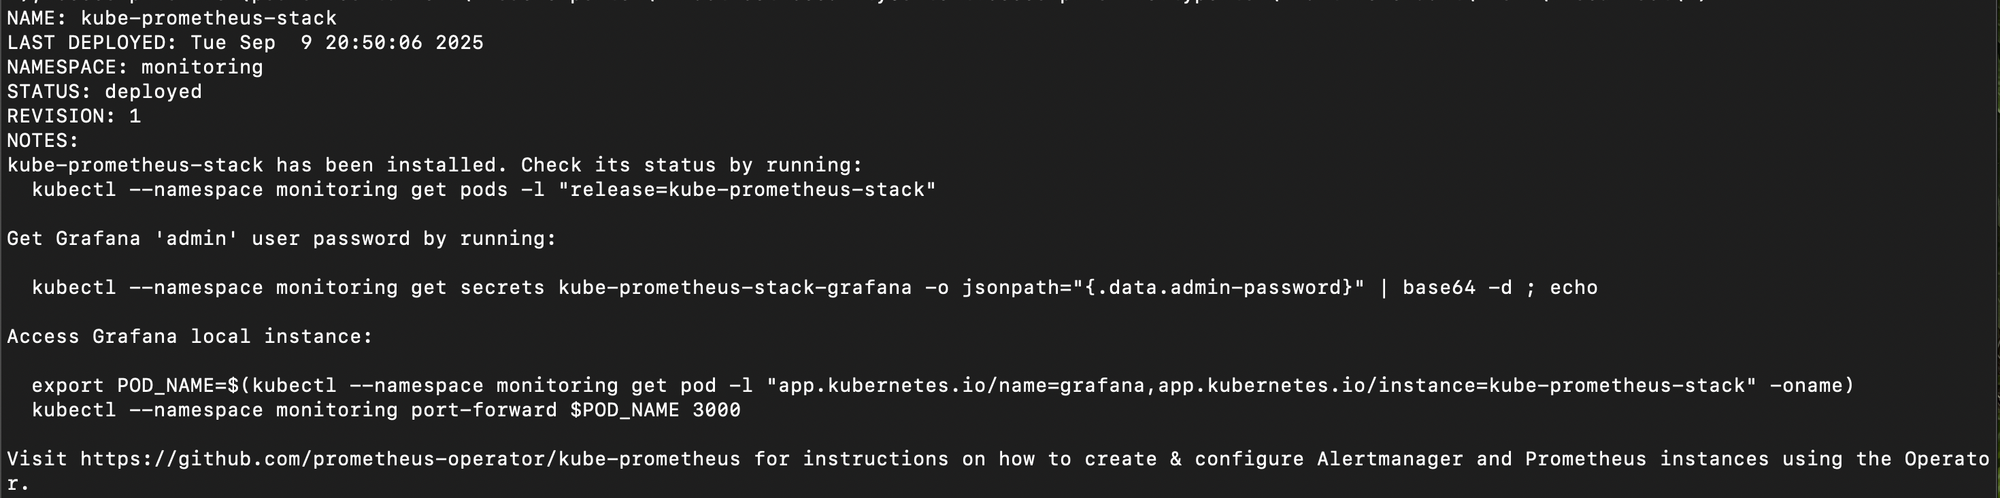
- This will deploy Prometheus, Grafana, Alertmanager, and related components in one go. We can check the status of the items that got deployed.
kubectl get all -n monitoring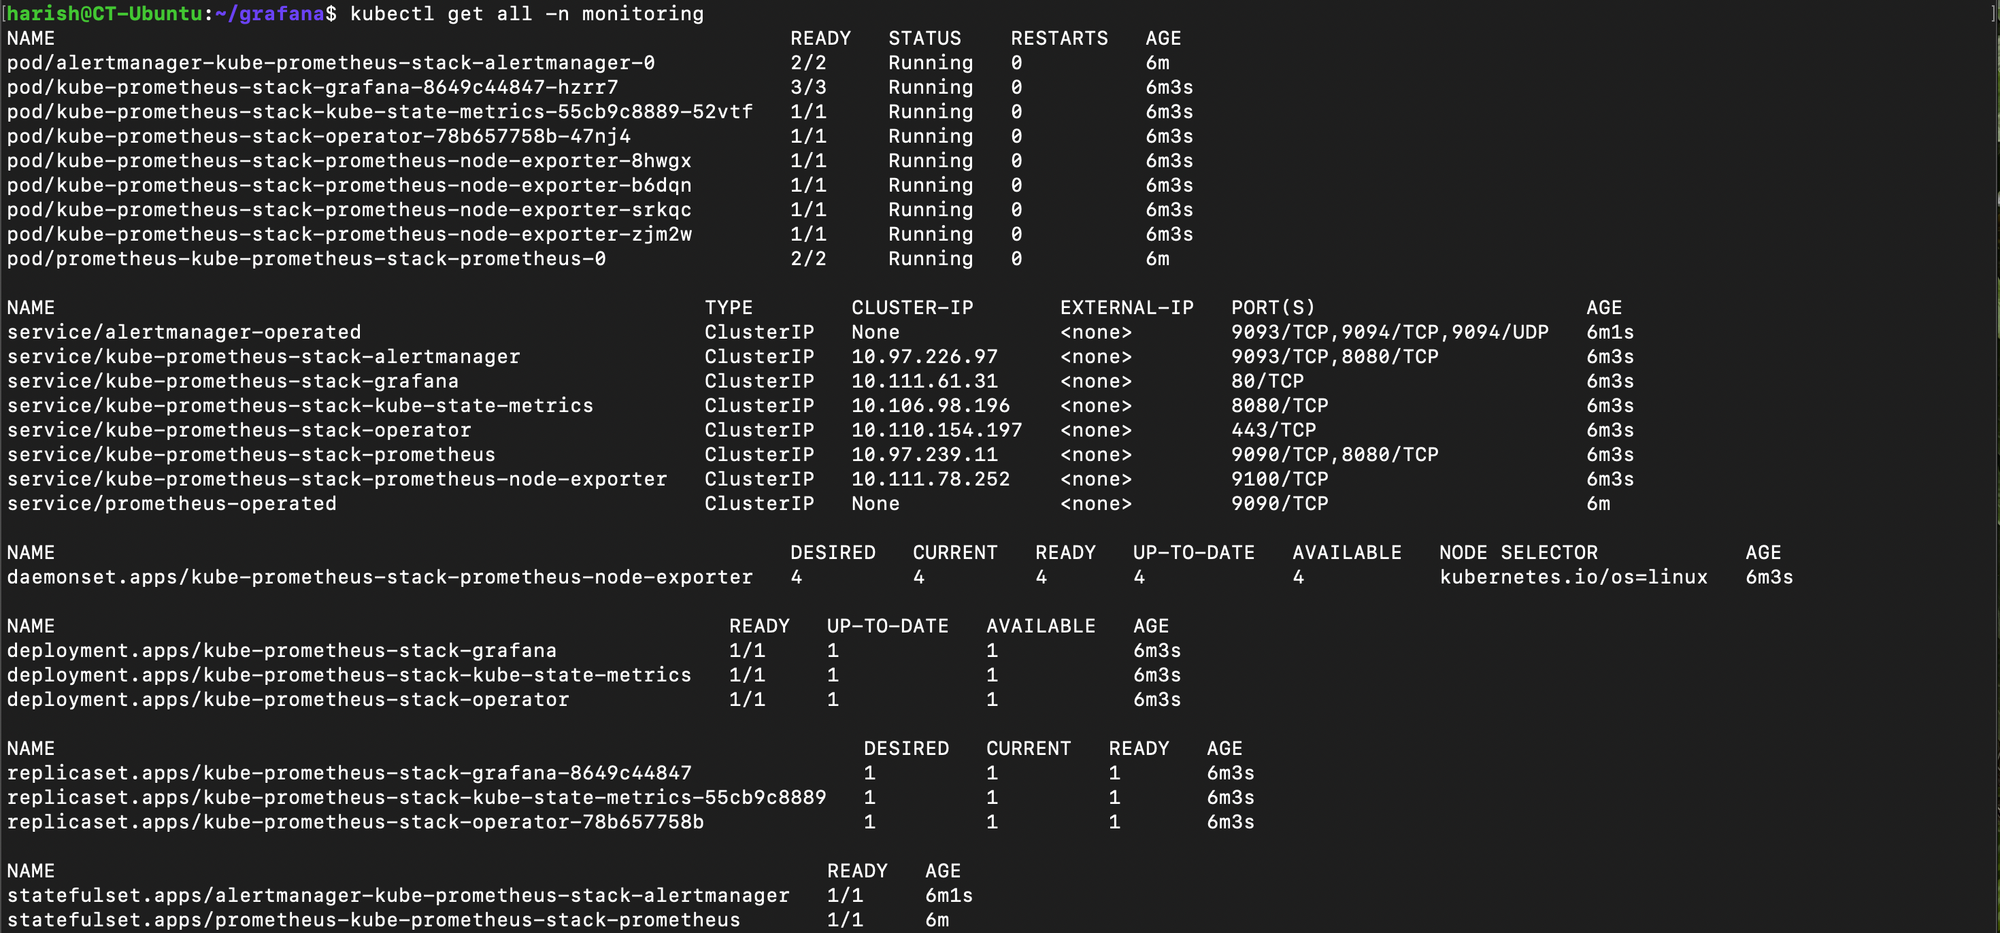
- Give it a minute or two, and soon, we'll see all the pods running and the various other components that got deployed alongside it.
Accessing Grafana:
By default, Grafana runs inside the cluster and is not exposed externally. To reach it, let's use an Ingress.
- First, let's check the Grafana service.
kubectl get svc -n monitoring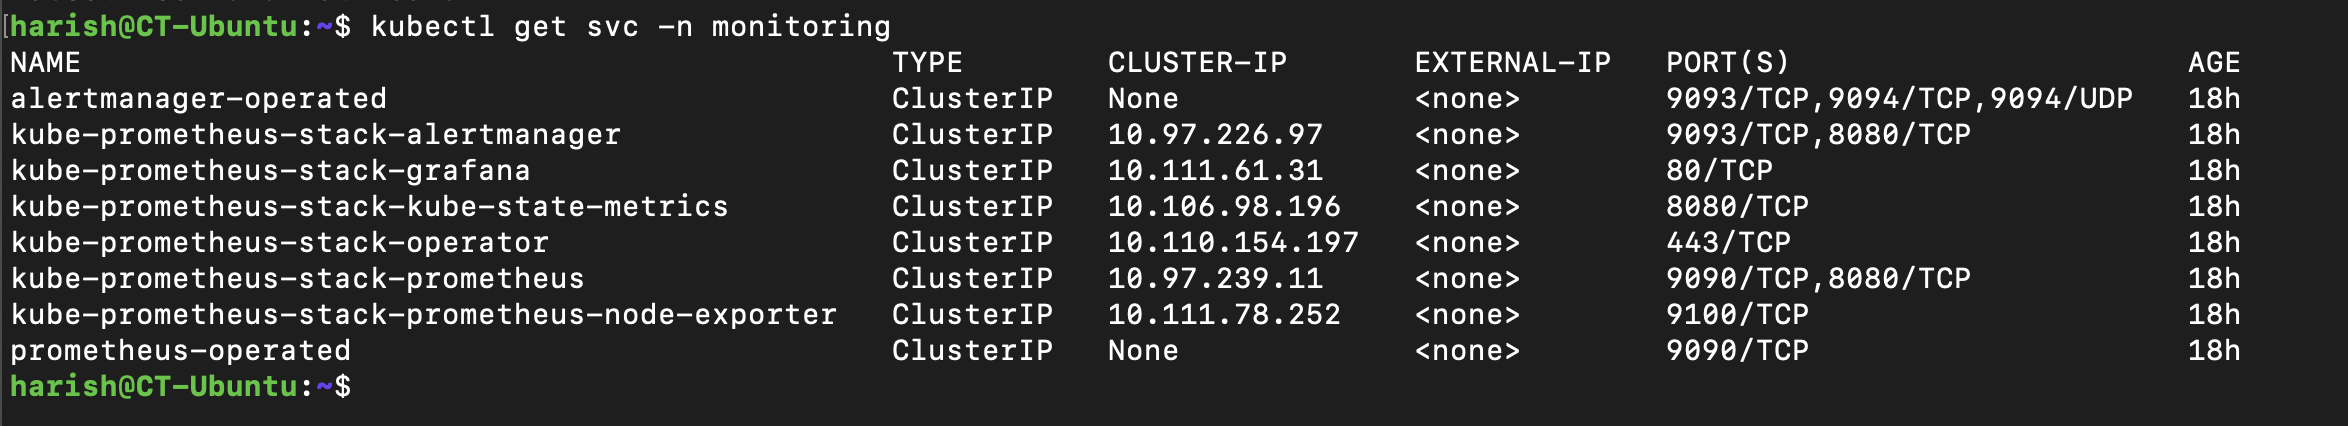
- Now, we can create an ingress manifest grafana-ingress.yaml.
apiVersion: networking.k8s.io/v1
kind: Ingress
metadata:
  name: kube-prometheus-stack-grafana
  namespace: monitoring
  annotations:
    nginx.ingress.kubernetes.io/backend-protocol: "HTTP"
spec:
  ingressClassName: nginx
  rules:
  - host: grafana.kube.harish2k01.xyz
    http:
      paths:
      - path: /
        pathType: Prefix
        backend:
          service:
            name: kube-prometheus-stack-grafana
            port:
number: 80- Now again, as stated in my last article on Longhorn, I have configured my SSL certs and my DNS to point to this cluster for all *.kube.harish2k01.xyz sub-domains. Hence, I can directly give the domain name under the host section in the above ingress file.
- Make sure to take care of this in your network configurations so that you will be able to access the Grafana UI
- We can apply the ingress configuration using:
kubectl apply -f grafana-ingress.yaml
- Now Grafana will be available at the domain name that we have provided in our ingress file, if we've set up DNS correctly.
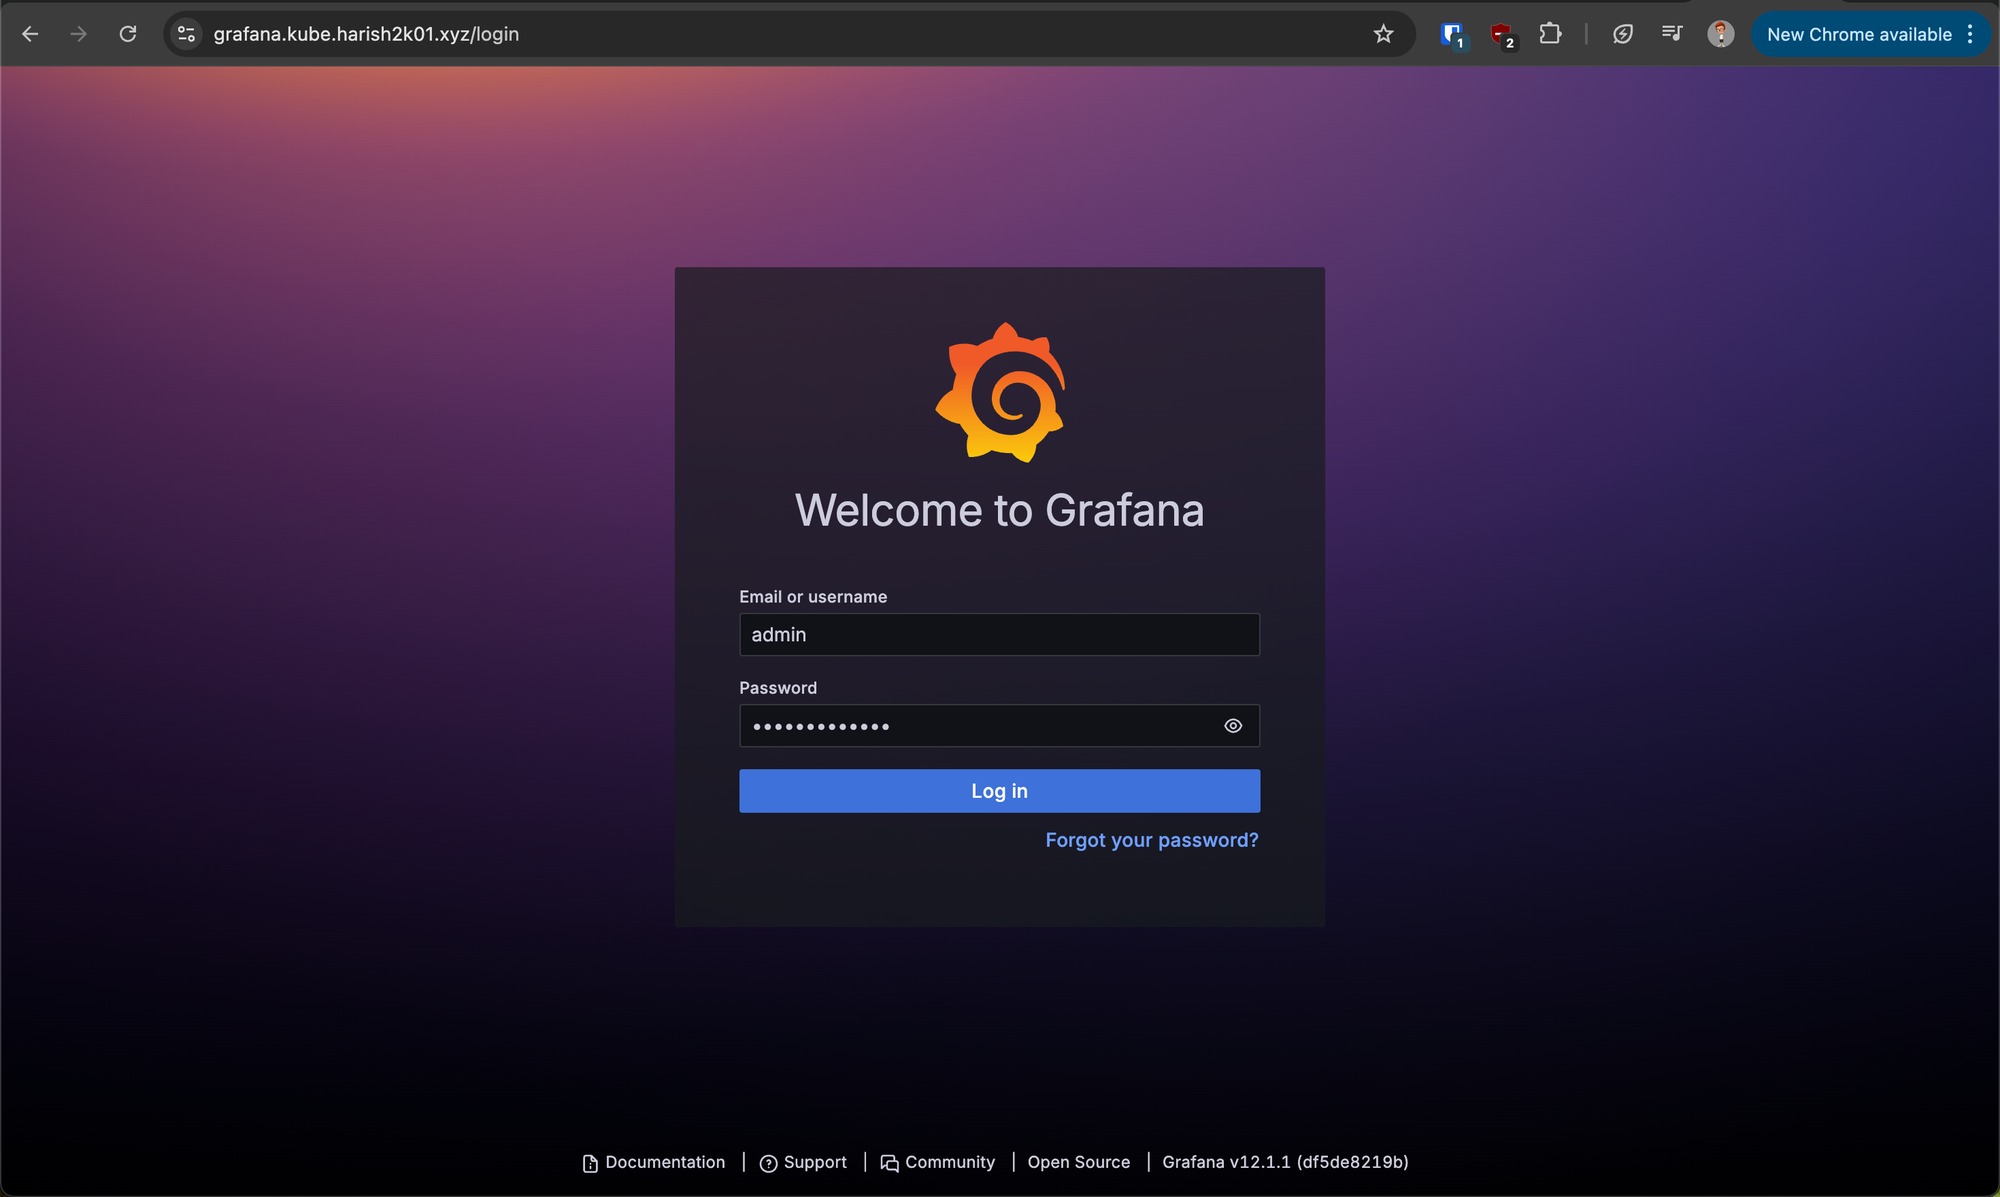
- Grafana sets a random admin password during installation. To retrieve it, we can use the command below.
kubectl get secret -n monitoring kube-prometheus-stack-grafana -o jsonpath="{.data.admin-password}" | base64 --decode ; echo
- Once logged in, you'll see Grafana dashboards already preloaded for Kubernetes nodes, pods, workloads, and cluster health.
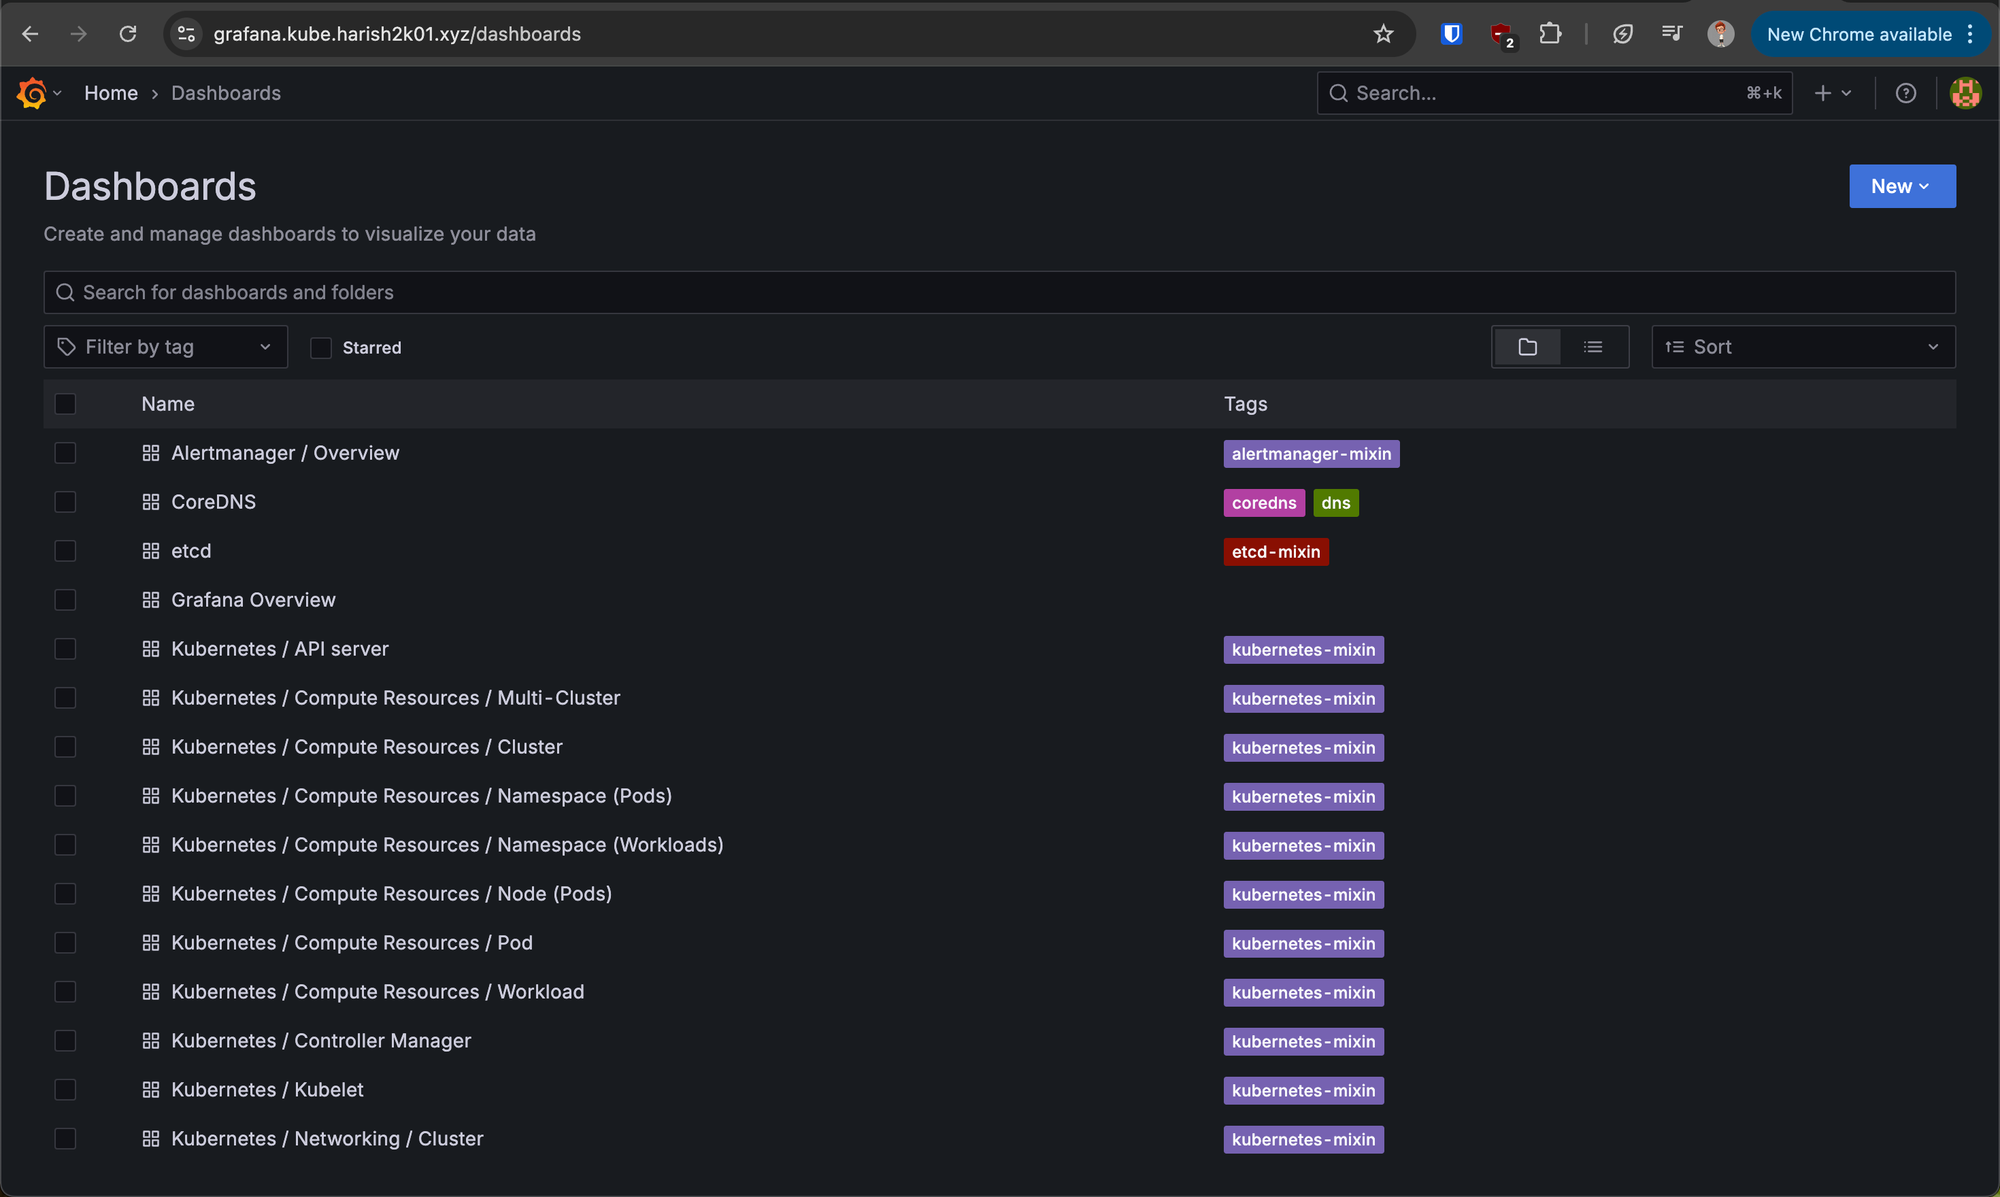
Exploring Dashboards:
The kube-prometheus-stack automatically ships with dashboards like:
- Kubernetes / Compute Resources - CPU & Memory usage per node & pod
- Kubernetes / Networking - Traffic Stats
- Cluster / API Server - Health of the control plane
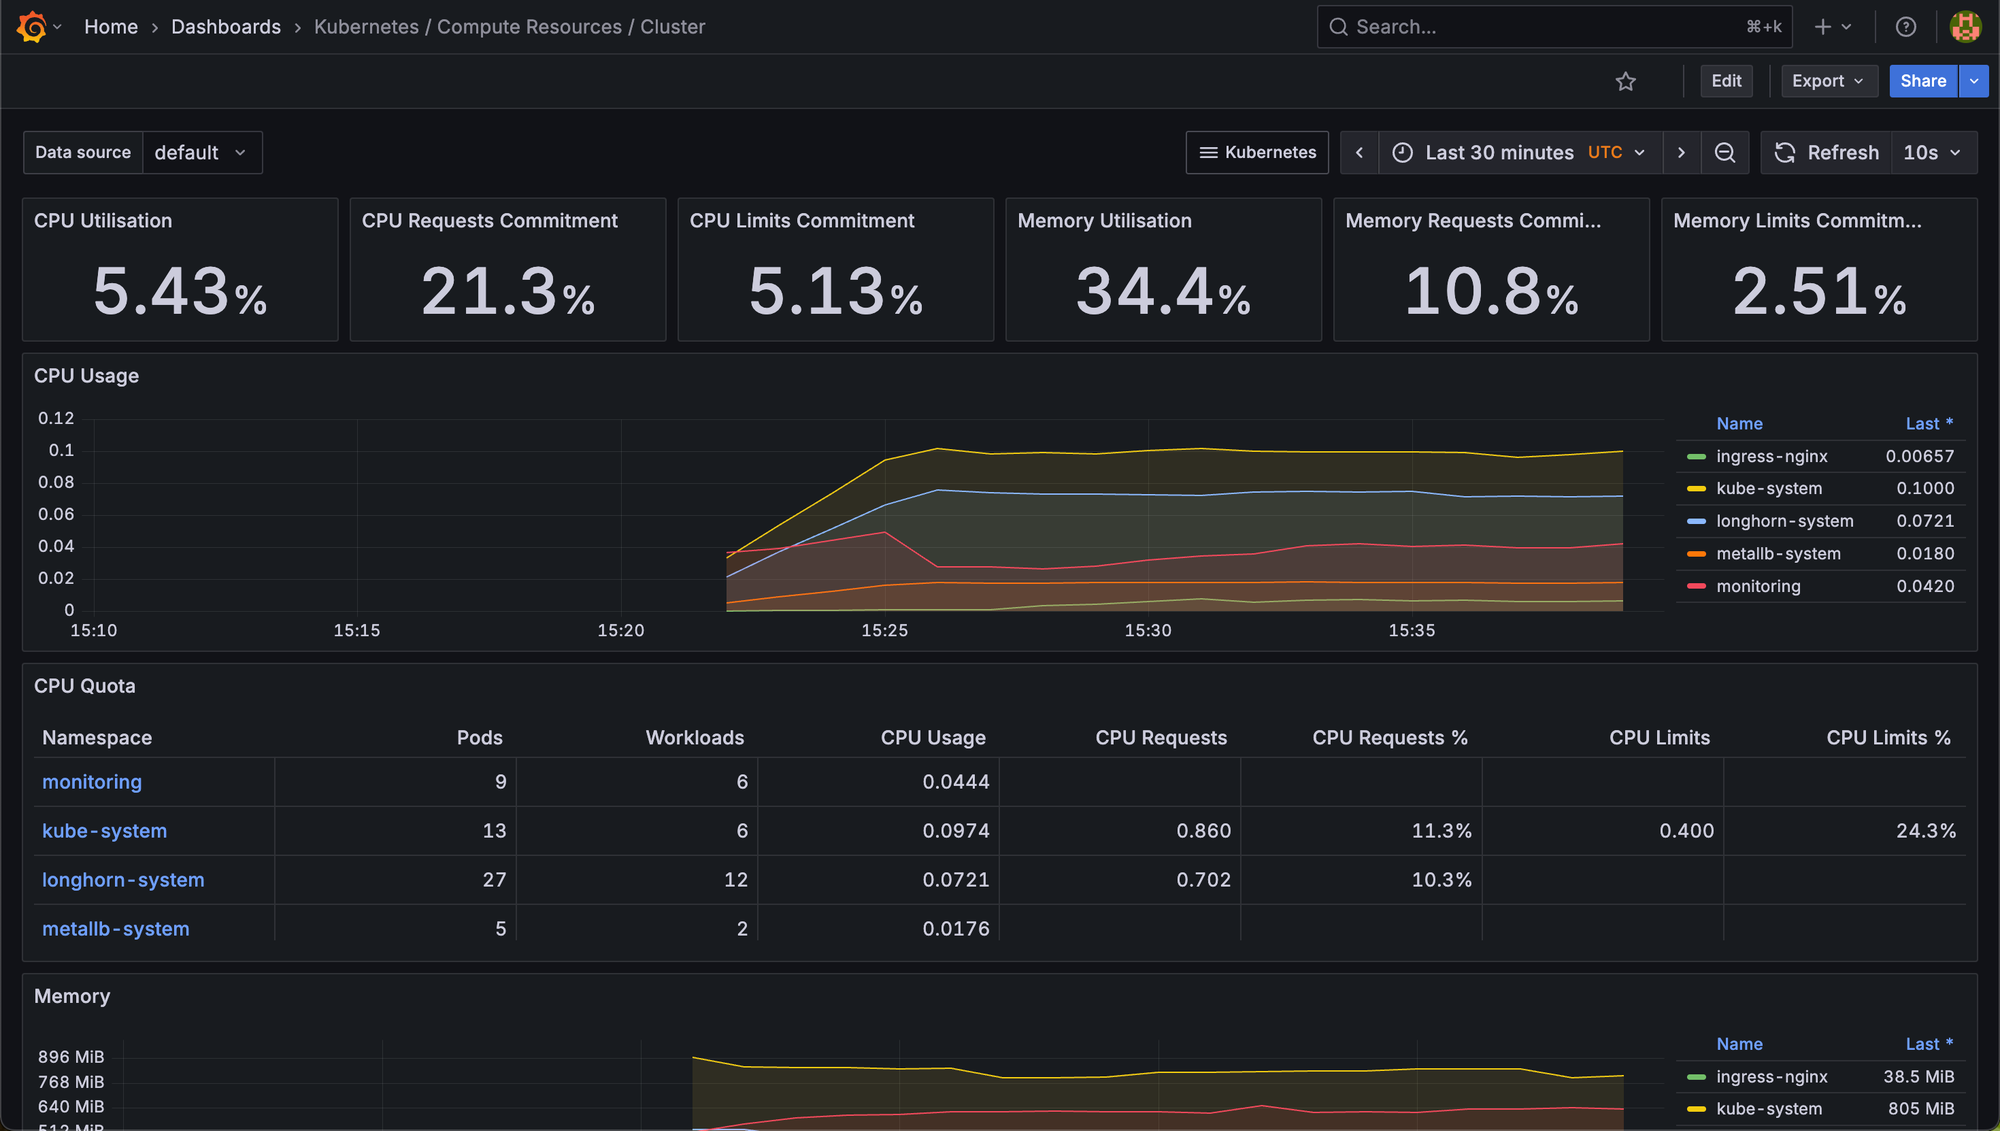
This gives us instant insights into our Home Lab cluster without manual setup.
If you want metrics, alerts, and Grafana dashboard changes to persist, you’ll need to enable persistence in the Helm values file and point it to a storage class.
In this article, we:
- Installed kube-prometheus-stack via Helm
- Exposed Grafana using Ingress
- Retrieved the Grafana admin password and logged in
- Explored built-in dashboards for cluster observability
With monitoring now in place, our cluster is no longer a black box. We can track performance, troubleshoot issues, and even set up alerts.
In the next article, we will be looking into another service that we will be deploying in our Home Lab. Stay tuned for more detailed instructions on expanding our Home Labbing capabilities.
Happy Homelabbing!!!


Member discussion